Investment Strategy Brief
2025 Outlook:
Investment Playbook
December 30, 2024

Executive Summary
- Investors should temper their return expectations during late-stage expansions and be watchful for excesses.
- If history is a guide, the current bull market still has room to run despite premium valuations and the late-stage expansion.
- Investors may benefit from opportunities in small caps and Japanese equities based on fair valuations and strong earnings expectations.
- Premium valuations and a late-stage expansion justify neutral risk positioning with active rebalancing and diversification efforts.
Investors should temper their return expectations during late-stage expansions and be watchful for excesses

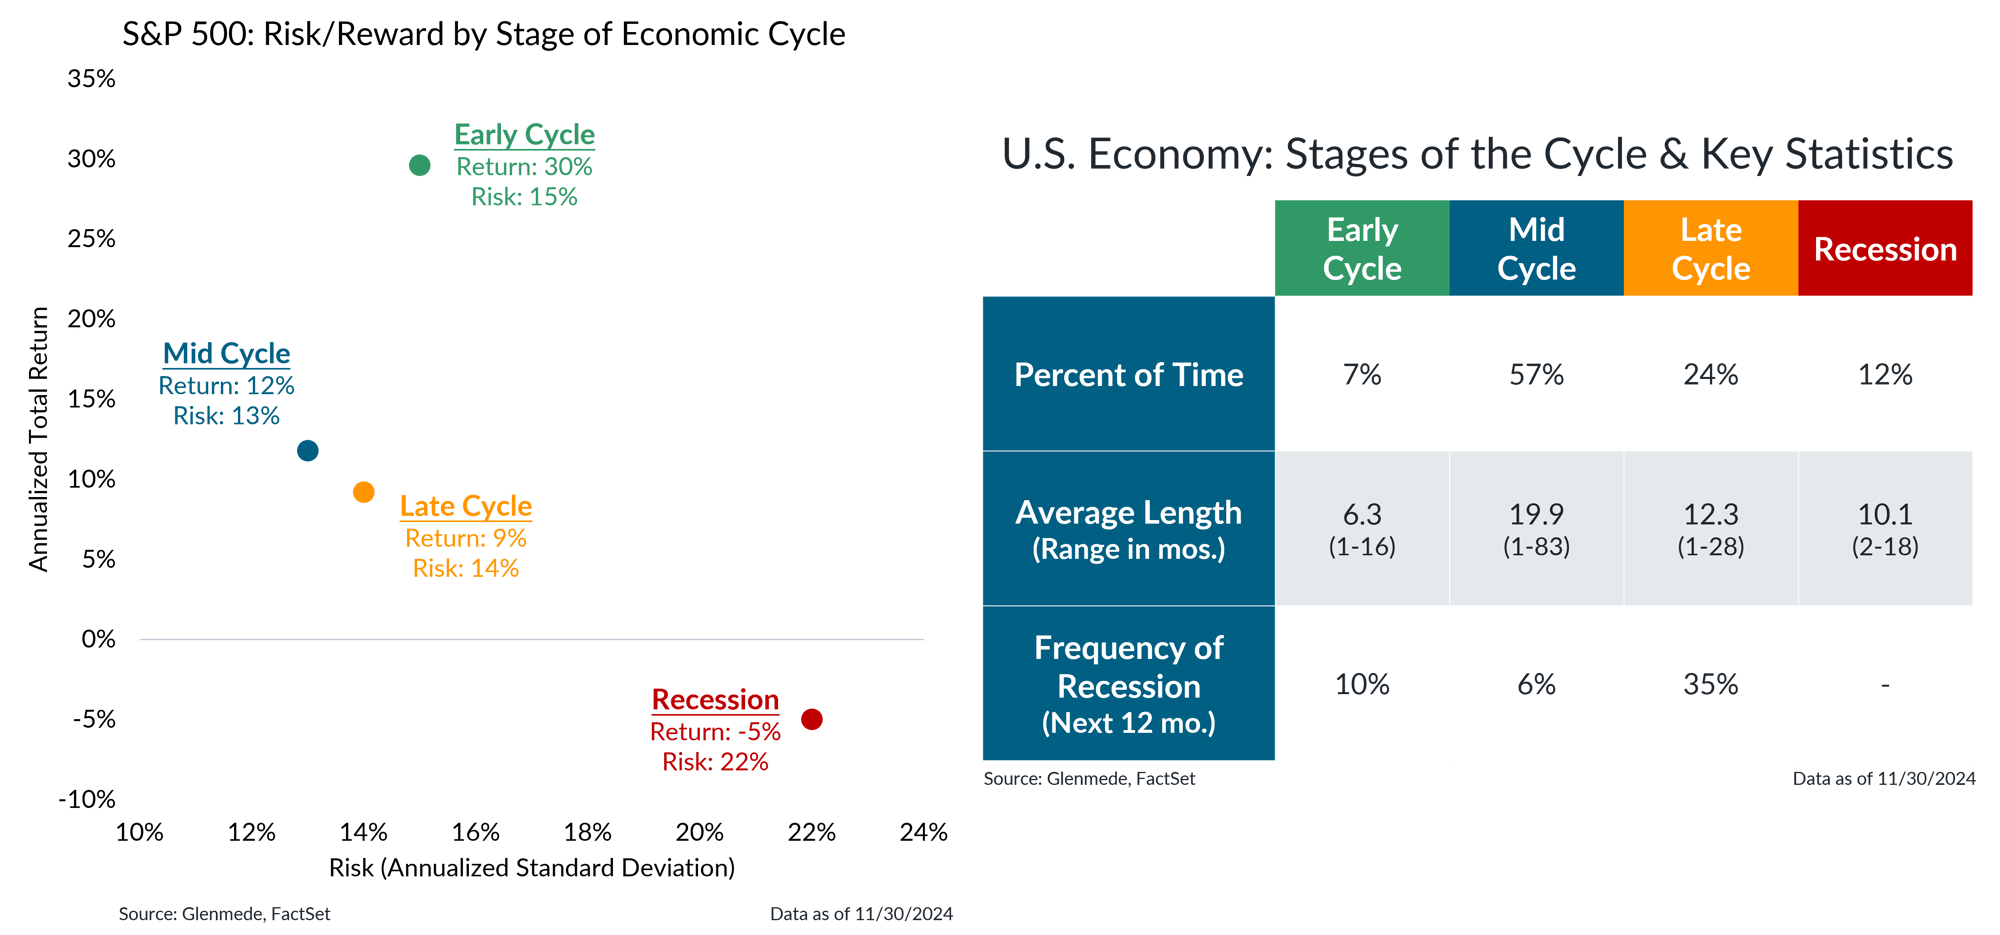
Shown in the left panel are annualized total returns (y-axis) and annualized standard deviations of total returns (x-axis) for the S&P 500 during the various stages of the economic cycle since 1962. The stages of the economic cycle are defined as the following: Recession refers to periods of economic downturn, Early Cycle to rebounds from recessions, Mid Cycle to ongoing growth up to the economy’s potential and Late Cycle to periods where the economy is operating at or above potential. The table in the right panel shows key statistics around the stages of the business cycle in the U.S. since 1962, based on a Glenmede analysis of typical economic behavior from a handful of leading and excess indicators. The S&P 500 is a market capitalization weighted index of large cap stocks in the U.S. Past performance may not be indicative of future results. One cannot invest directly in an index.
- The S&P 500 has historically delivered 9% returns during late cycle which may not be as robust as in early (30%) and mid cycle (12%), but strong enough to warrant a full weight to risk assets.
- Investors should avoid complacency and remain watchful for excesses due to higher recession risks in a late-stage expansion.
Equity valuations remain above fair value

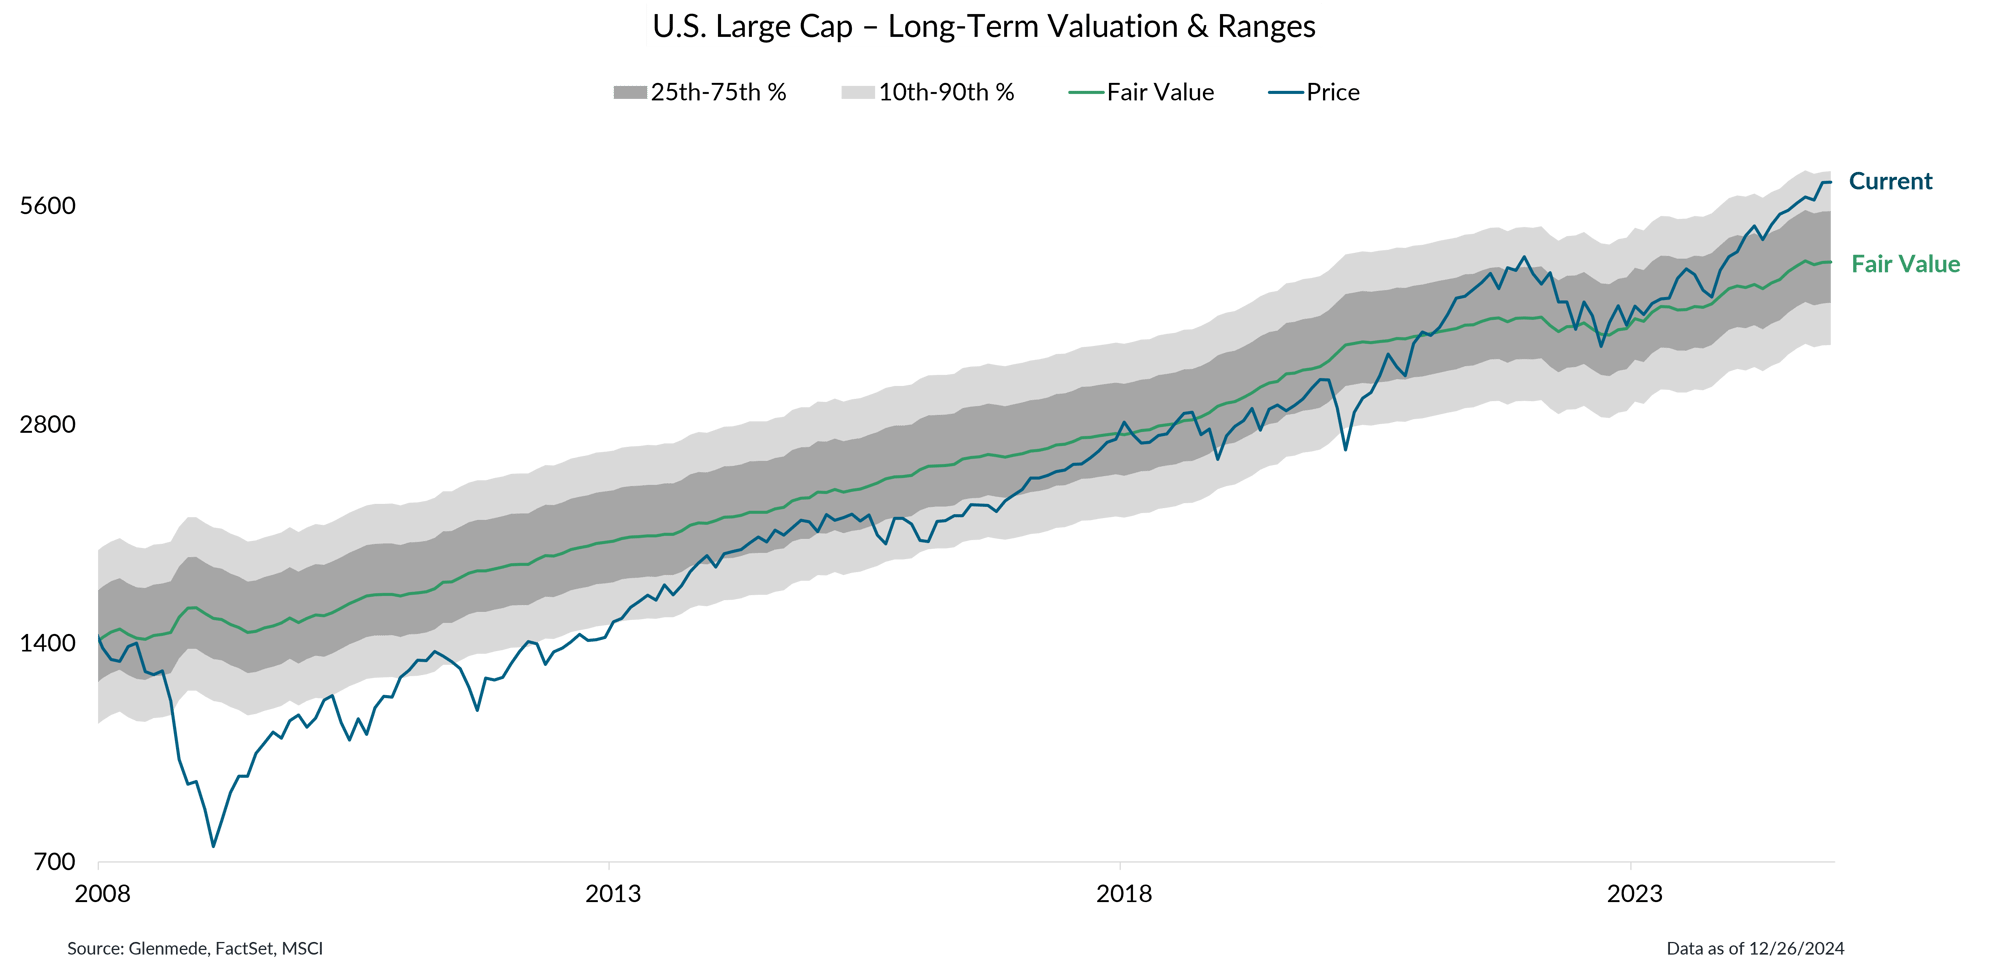
Glenmede’s estimate of long-term fair value for U.S. large cap is based on normalized earnings, dividend yield and book value using MSCI’s USA Index, which is a total return index with dividends reinvested. Past performance may not be indicative of future results. Glenmede’s estimates of fair value are arrived at in good faith, but longer-term targets for valuation may be uncertain. One cannot invest directly in an index.
- Another dimension investors must consider is valuations, as the price one pays for an investment is a key determinant of returns over the long run.
- Large cap equities currently sit at the 87th percentile of longer-term fair value based on various metrics, including normalized earnings, cash flows, dividend yield and book value.
Does a late-cycle bull market with premium valuations have further room to run? History says yes

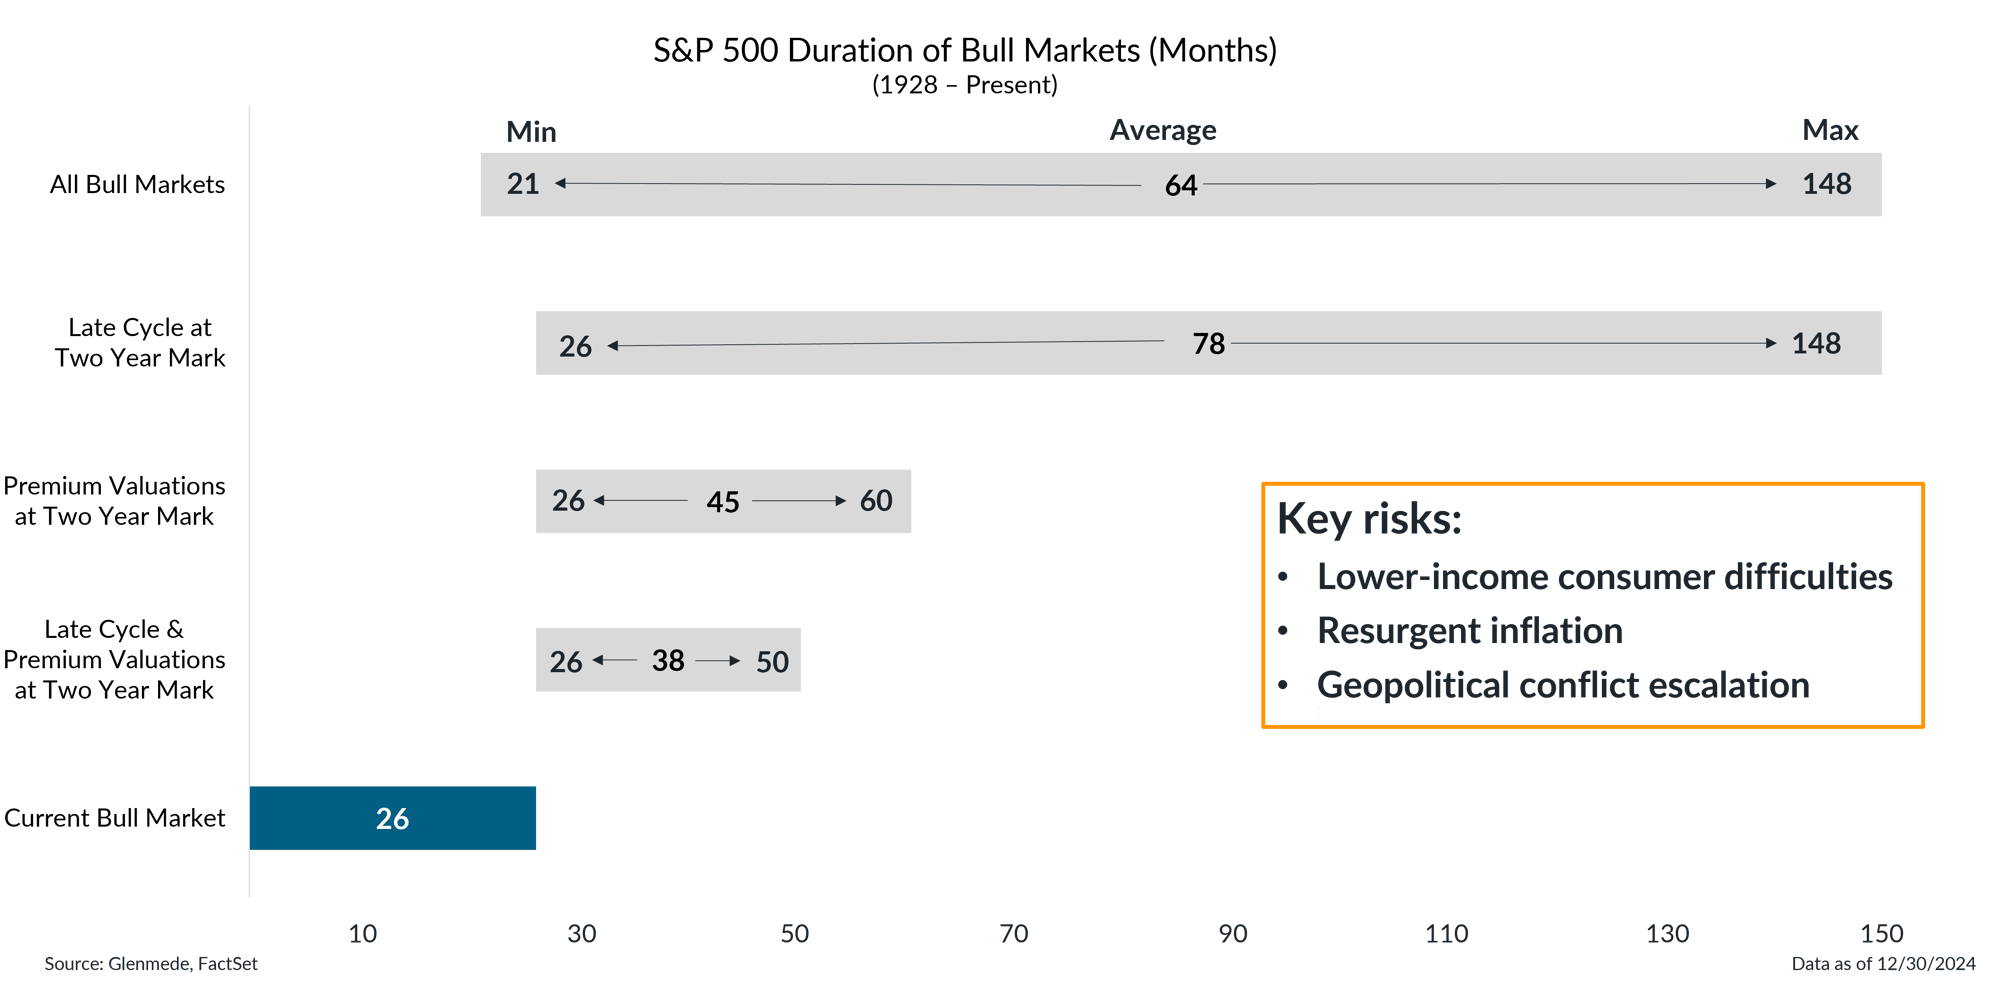
Data shown are statistics for the duration of various bull markets in U.S. large cap equities, as represented by the S&P 500. All Bull Markets includes every bull market since 1928. Late Cycle at Two Year Mark refers only to bull markets that were in the late stage of a U.S. economic expansion two years in. Premium Valuations at Two Year Mark refers only to bull markets in which U.S. large cap equities had premium valuations two years in. Late Cycle & Premium Valuations at Two Year Mark refers only to bull markets that are included in both prior criteria. Current Bull Market refers to the ongoing bull market which began in 2022. The S&P 500 is a market capitalization weighted index of large cap stocks in the U.S. Past performance may not be indicative of future results. One cannot invest directly in an index.
- The average bull market in the S&P 500 since 1928 has lasted 64 months, with upswings ranging from 21 to 148 months.
- The subset of those bull markets that were both late cycle and had premium valuations at the two-year mark lasted on average 38 months, with a 26 to 50 month range.
- The current bull market is 25 months old, suggesting that this may not be a fatal combination, but it does justify a neutral overall risk posture given the relatively balanced implications for risk assets.
Domestic equities appear expensive but are mostly driven by significant premiums in growth stocks

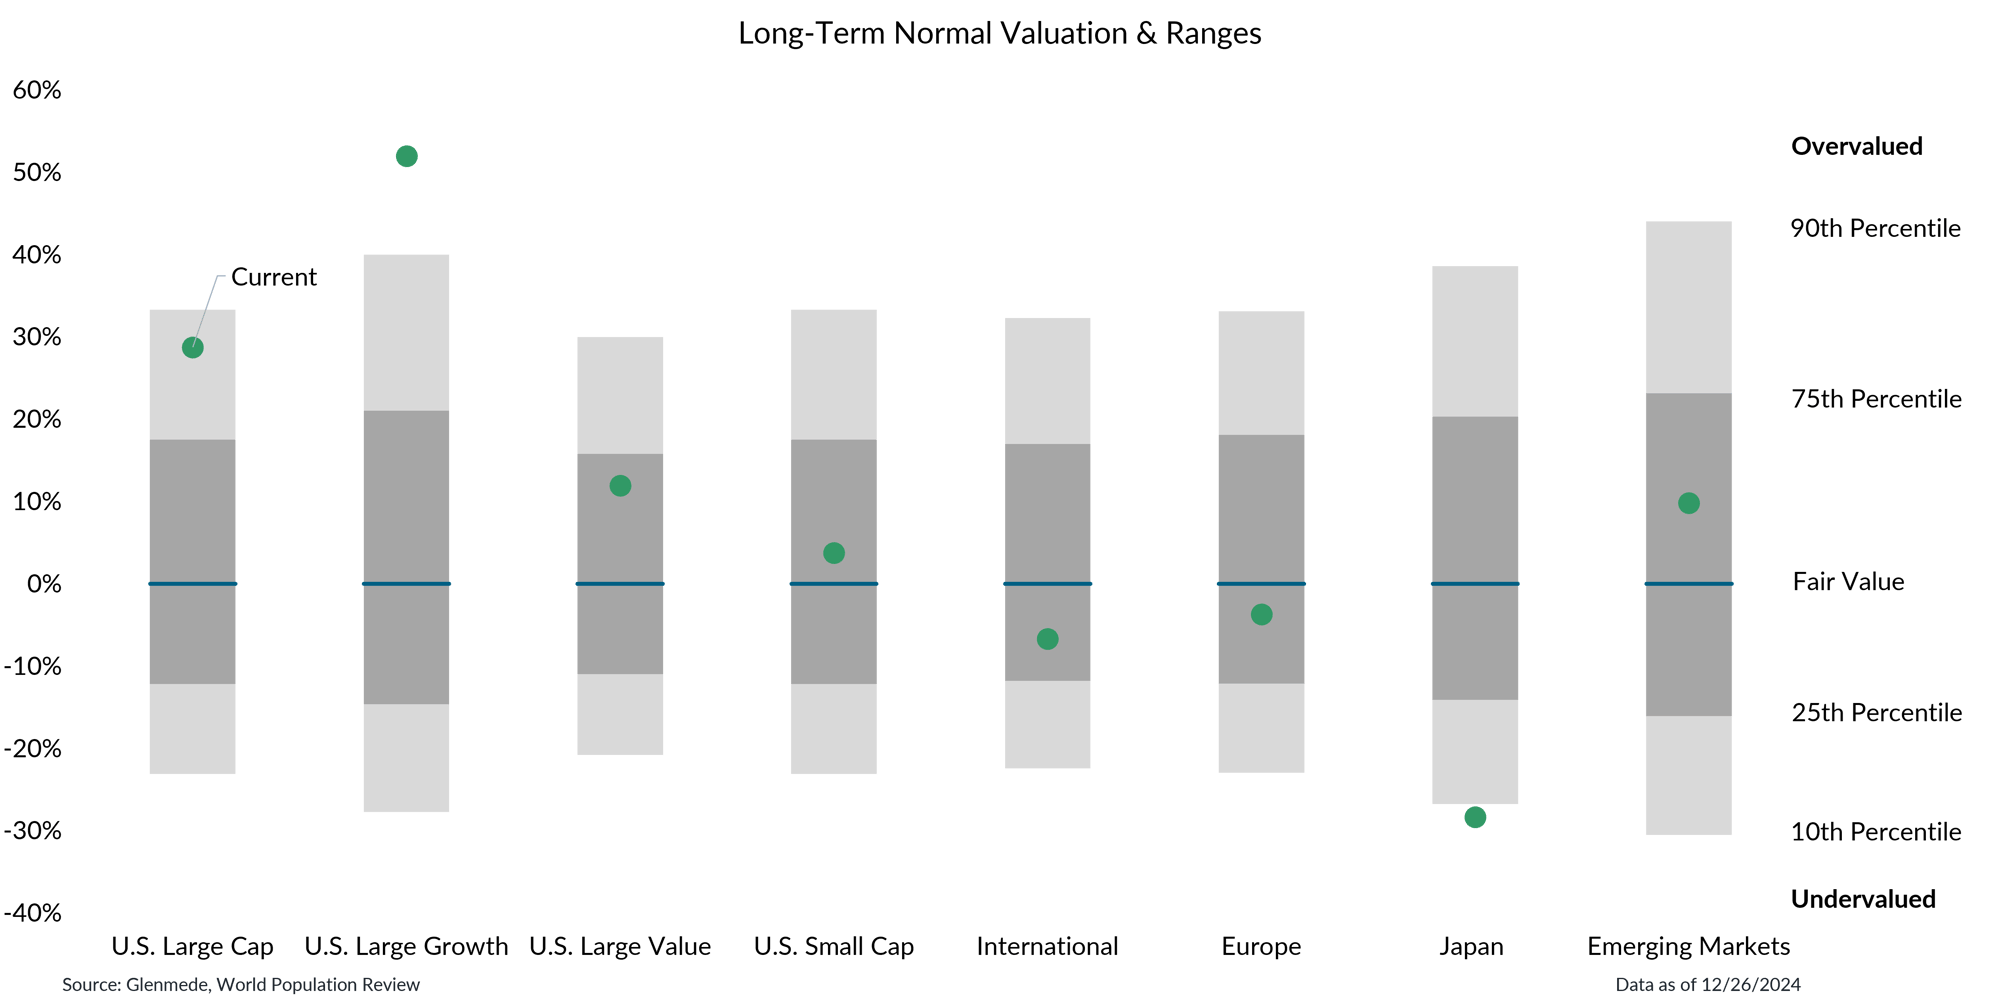
Data shown are Glenmede’s estimates of long-term fair value for U.S. Large Cap (MSCI USA), U.S. Large Cap Growth (MSCI USA Growth), U.S. Large Value (MSCI USA Value), U.S. Small Cap (MSCI USA Small Cap), International (MSCI All Country World ex-U.S.), Europe (MSCI Europe), Japan (MSCI Japan) and Emerging Markets (MSCI Emerging Markets) based on normalized earnings, normalized cash flows, dividend yield and book value of each index. Past performance may not be indicative of future results. One cannot invest directly in an index.
- U.S. large cap premium valuations are mostly driven by growth stocks which sit at the 95th percentile, significantly extended compared to their value counterparts at the 70th percentile.
- Investors may benefit from opportunities in small caps and Japanese equities based on fair valuations and a robust earnings growth backdrop heading into 2025.
This material is intended to review matters of possible interest to Glenmede Trust Company clients and friends and is not intended as personalized investment advice. When provided to a client, advice is based on the client’s unique circumstances and may differ substantially from any general recommendations, suggestions or other considerations included in this material. Any opinions, recommendations, expectations or projections herein are based on information available at the time of publication and may change thereafter. Information obtained from third-party sources is assumed to be reliable but may not be independently verified, and the accuracy thereof is not guaranteed. Outcomes (including performance) may differ materially from any expectations and projections noted herein due to various risks and uncertainties. Any reference to risk management or risk control does not imply that risk can be eliminated. All investments have risk. Clients are encouraged to discuss any matter discussed herein with their Glenmede representative.

Feature one
Use text and images to tell your company’s story. Explain what makes your product or service extraordinary.

Feature two
Use text and images to tell your company’s story. Explain what makes your product or service extraordinary.

Feature three
Use text and images to tell your company’s story. Explain what makes your product or service extraordinary.

