

Investment Strategy Brief | September 13, 2026
A Sticky Situation for the Fed

Executive Summary
-
The Fed faces a resilient labor market and inflation that remains stubbornly above the 2% target.
-
Energy markets are reflecting the increased risks to key Middle East chokepoints and infrastructure.
-
The Fed may cite services (ex-shelter) inflation as an area where progress toward target remains unconvincing.
-
Following last week’s inflation report, markets are pricing a high likelihood of a rate hike at this week’s FOMC meeting.
-
While higher oil prices have yet to spill over into broader inflation, sticky services inflation strengthens the case for a rate hike.
The Fed faces a resilient labor market and inflation that remains stubbornly above the 2% target
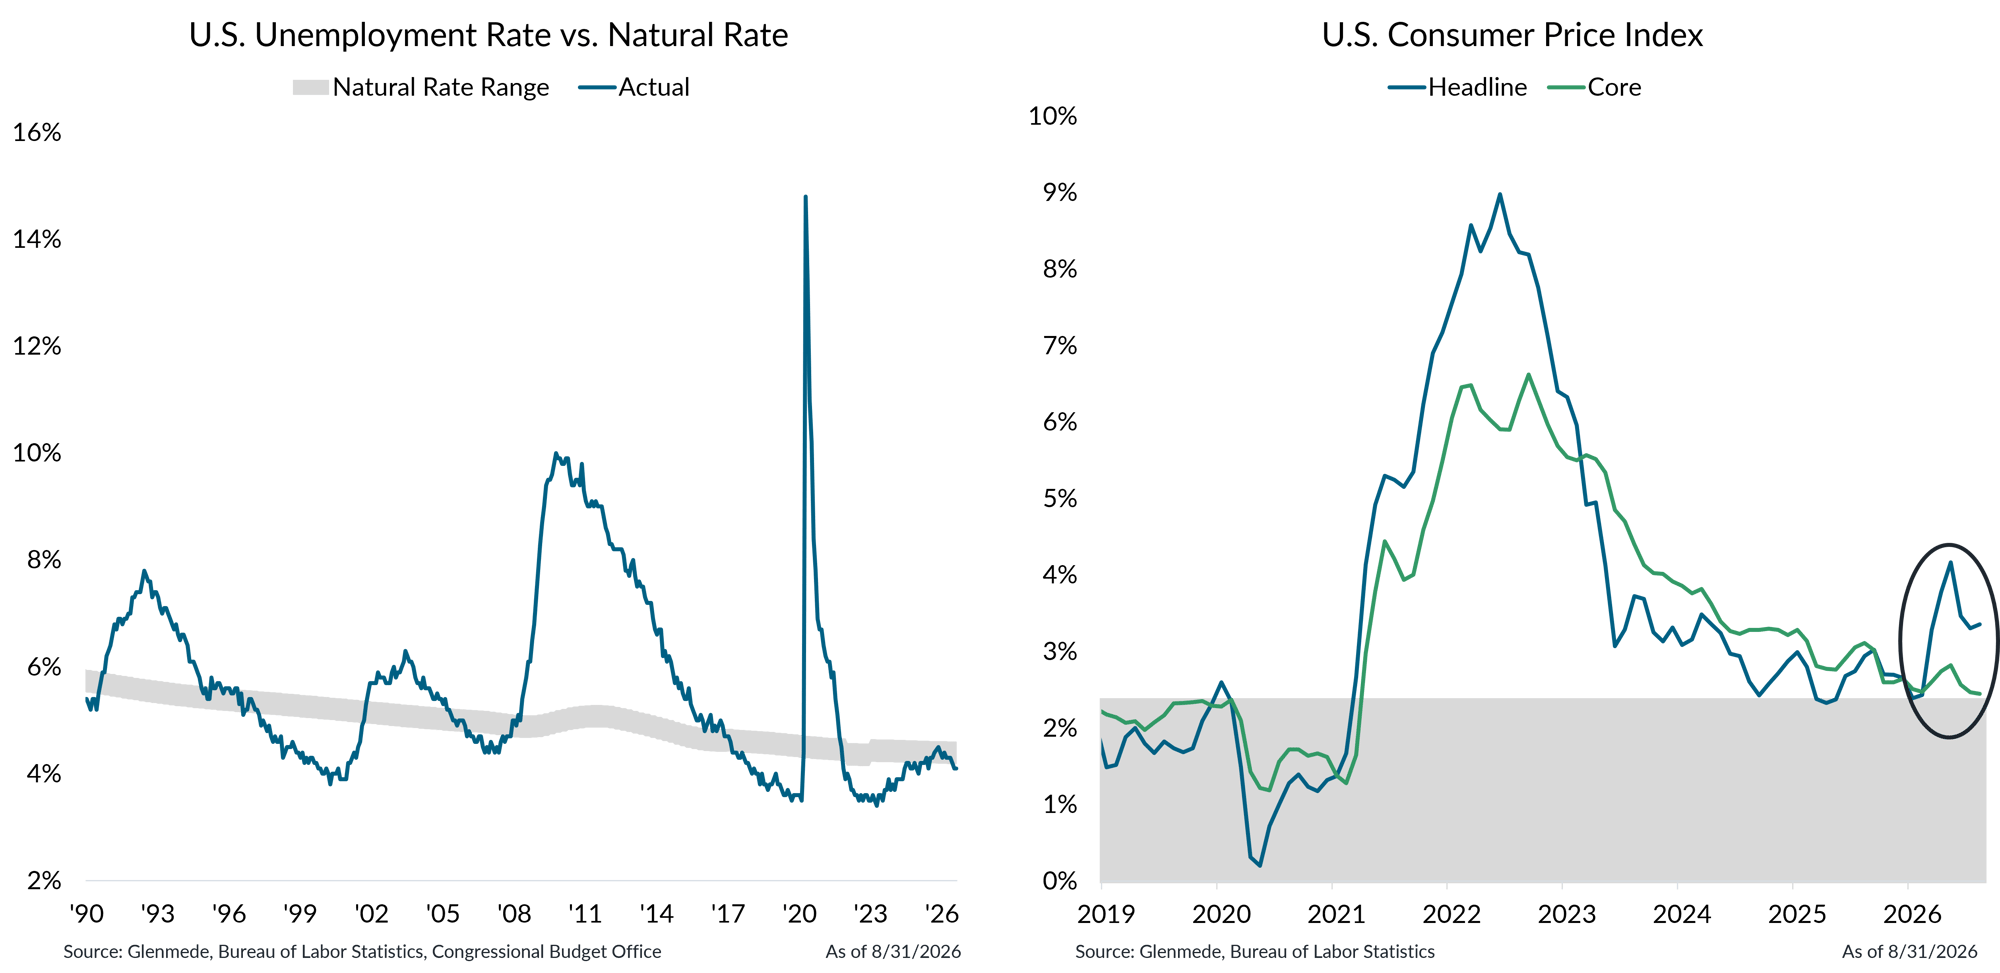
Shown on the left is the U.S. unemployment rate for persons aged 16 years and over in blue and a range estimate of the natural rate of unemployment with a Glenmede-defined buffer in gray, which is the baseline level of joblessness estimated by Glenmede to persist in a well-functioning economy due to frictional and structural factors. Shown on the right are year-over-year changes in the U.S. Consumer Price Index (CPI), with headline CPI shown in blue and core CPI shown in green. Headline CPI reflects changes in prices across all goods and services, while core CPI excludes food and energy prices to measure underlying inflation trends. The gray band represents the Federal Reserve’s target range consistent with its price stability objective.
-
After rising moderately last year, the unemployment rate has stabilized, easing concerns about labor market deterioration and allowing the Fed to refocus on inflation.
-
Inflation remains a key challenge for the Fed, with higher energy prices tied to Middle East tensions pushing headline readings higher.
Energy markets are reflecting the increased risks to key Middle East chokepoints and infrastructure
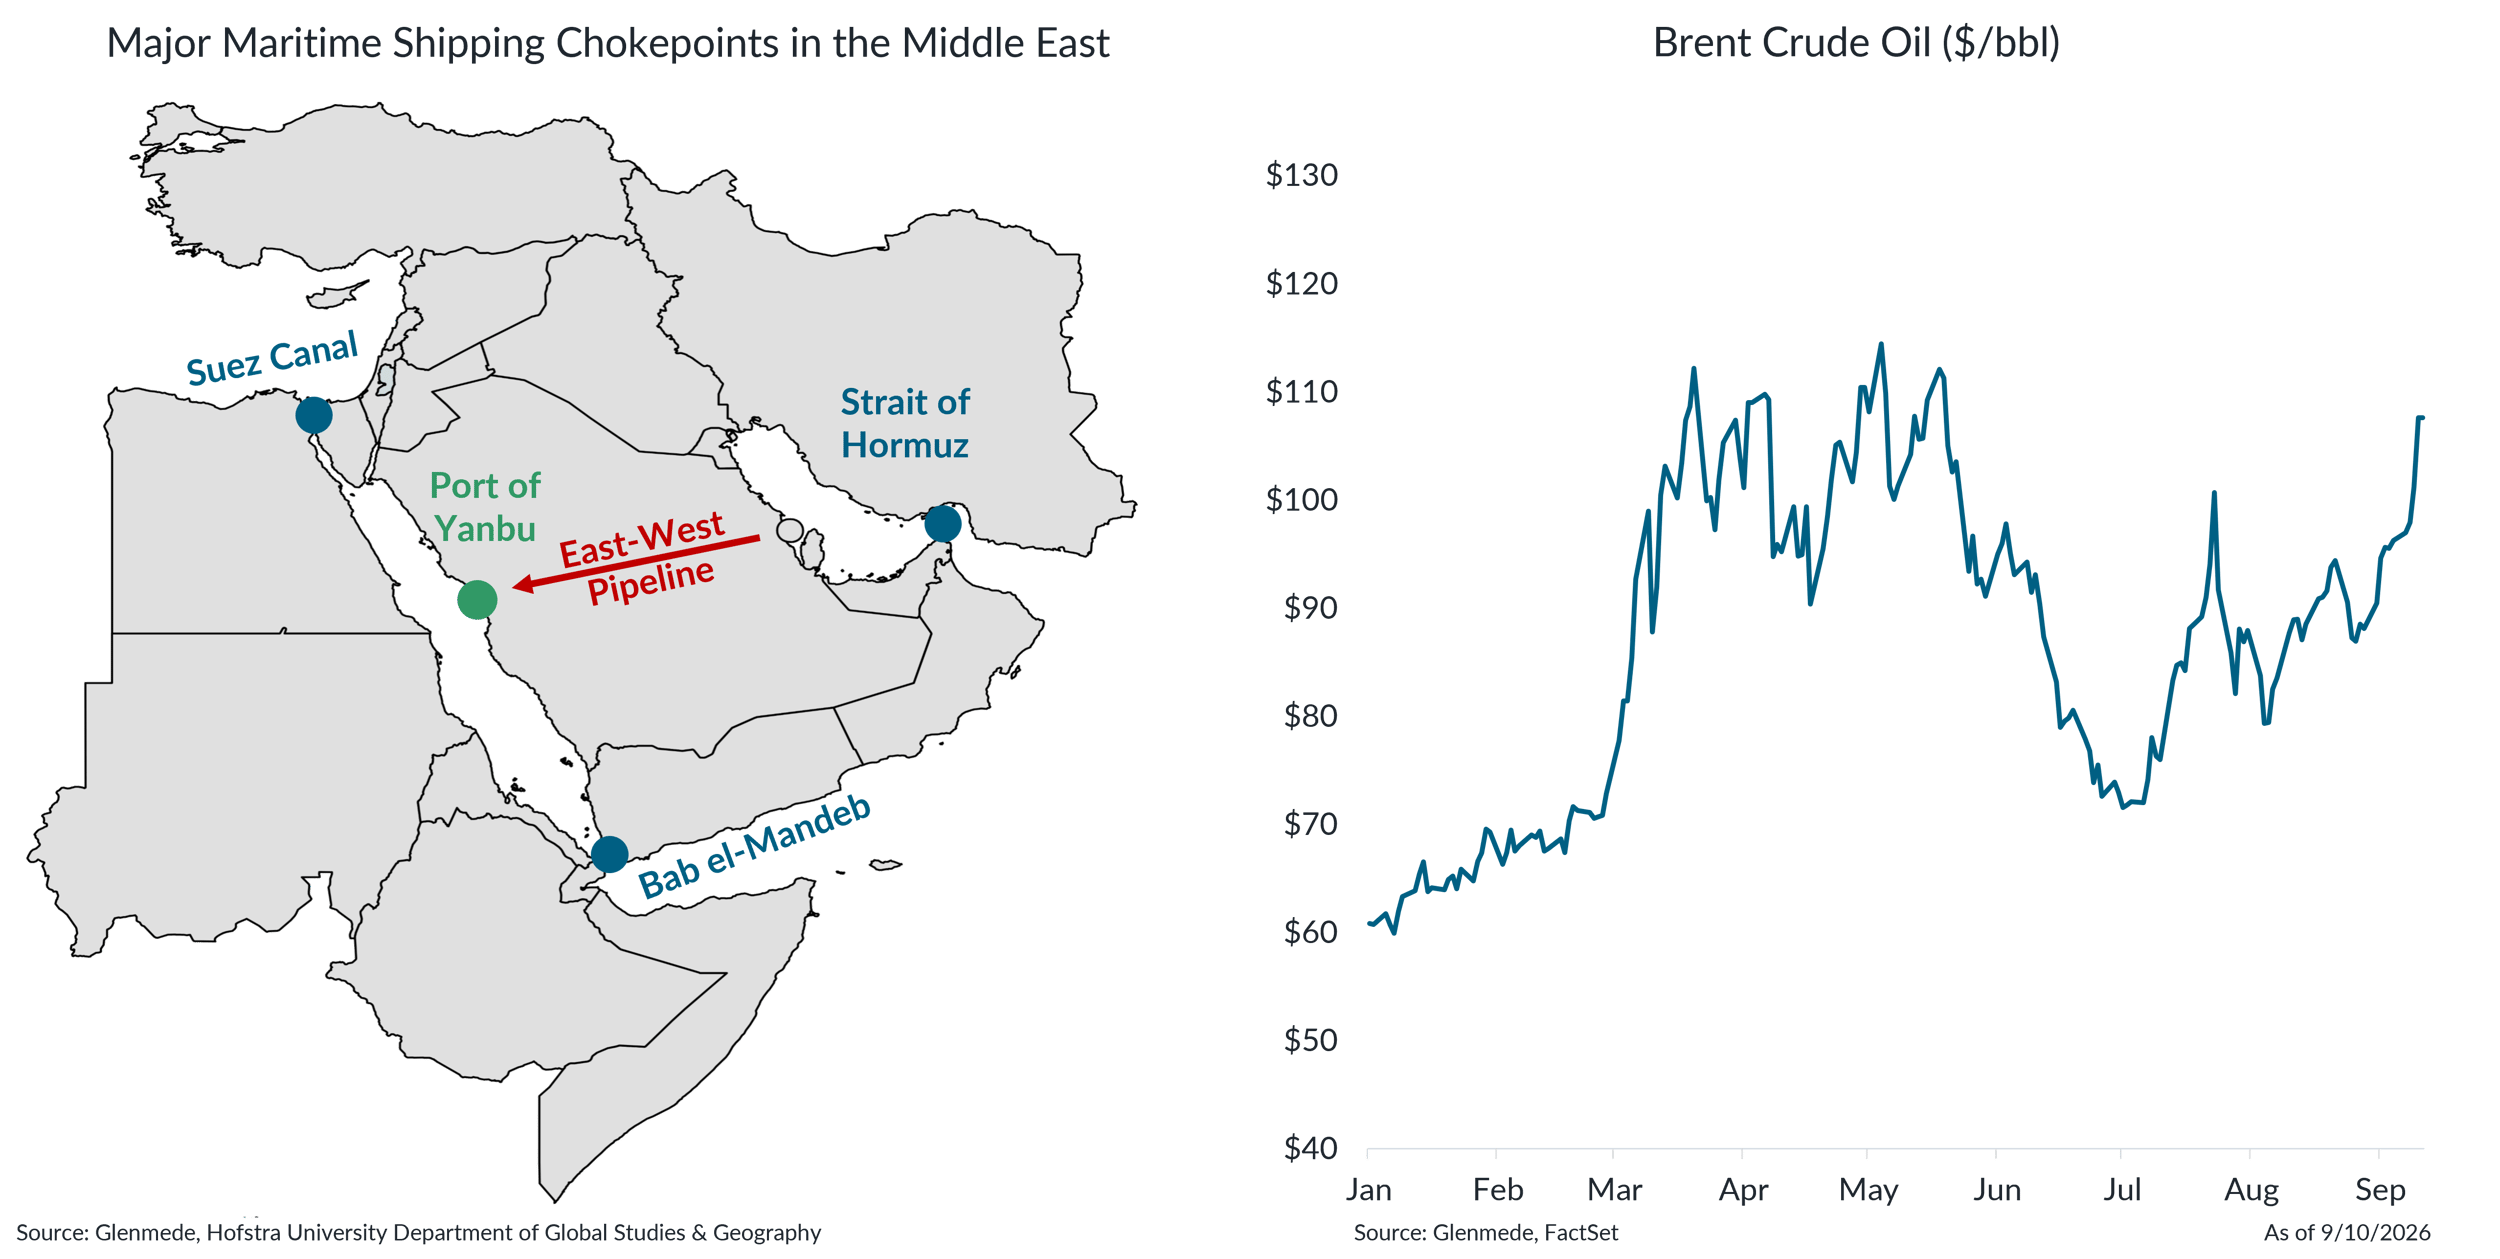
Shown on the left is a map of the Middle East and parts of Africa highlighting key oil transportation infrastructure. Blue dots represent major maritime shipping chokepoints, the green dot represents alternative export locations, and the red line represents Saudi Arabia’s East-West Pipeline. Shown on the right are the spot prices of Brent crude oil over time, measured in U.S. dollars per barrel.
-
Recent developments on the Arabian Peninsula have disrupted mitigation efforts to bypass the Strait of Hormuz, affecting both the Bab el-Mandeb and the East-West pipeline.
-
Disruptions to key Middle Eastern shipping routes and energy infrastructure have pushed oil prices back above $100 per barrel, reintroducing a meaningful geopolitical risk premium into energy prices
The Fed may cite services (ex-shelter) inflation as an area where progress toward target remains unconvincing
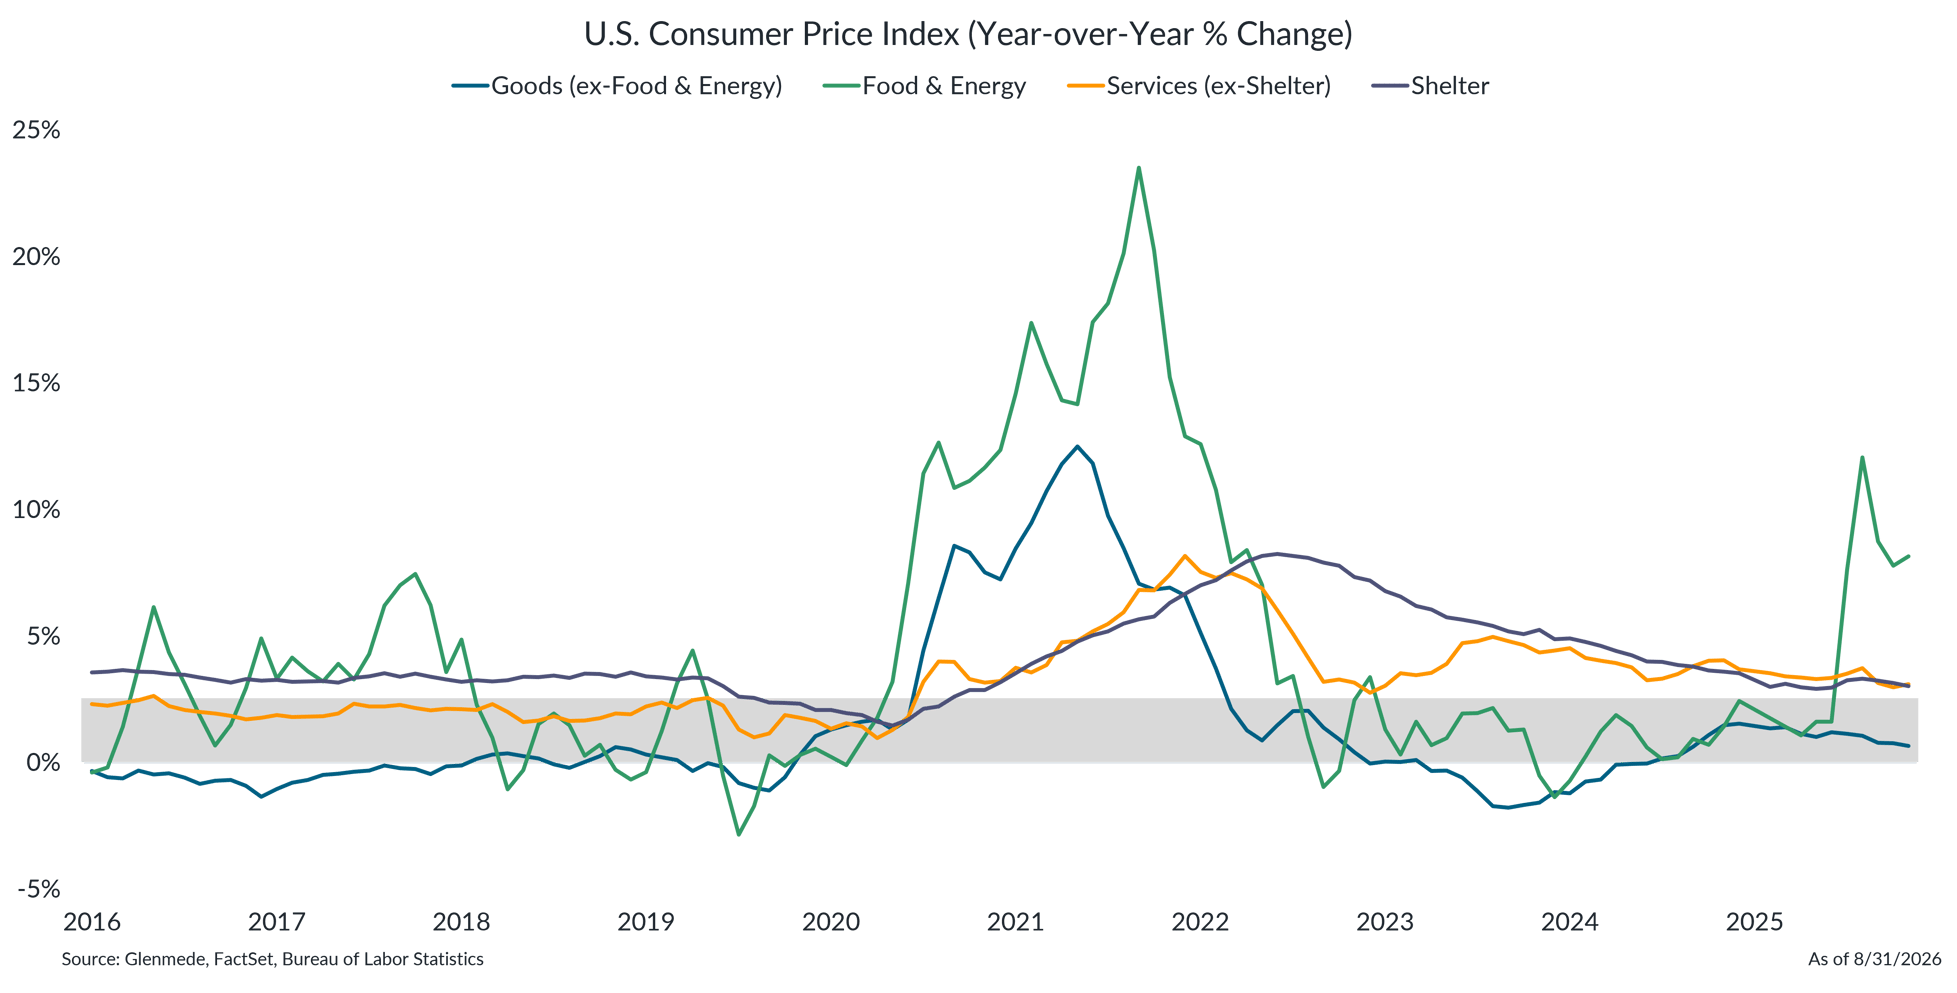
Shown are the year-over-year changes in select U.S. CPI components. Goods (ex-Food & Energy) is represented by the commodities component (excluding food & energy). Food & Energy is represented by the food & energy subcomponents. Services (ex-Shelter) is represented by Services Less Rent of Shelter. Shelter is represented by Rent of Shelter. CPI measures the price of a basket of goods & services consumed by U.S. households. The gray band represents the Federal Reserve’s target range consistent with its price stability objective.
-
Last week’s CPI report showed few signs that the energy-driven inflation wave has permeated broad goods prices. Energy is an input cost in some form or fashion for most goods, yet a material flow-through has yet to materialize.
-
On the other hand, the services half of the consumption basket has shown little convincing progress, suggesting that interest rates may not yet be sufficiently restrictive enough to push inflation back toward the Fed’s target range.
Following the inflation report, markets are pricing a high likelihood of a rate hike at the next FOMC meeting
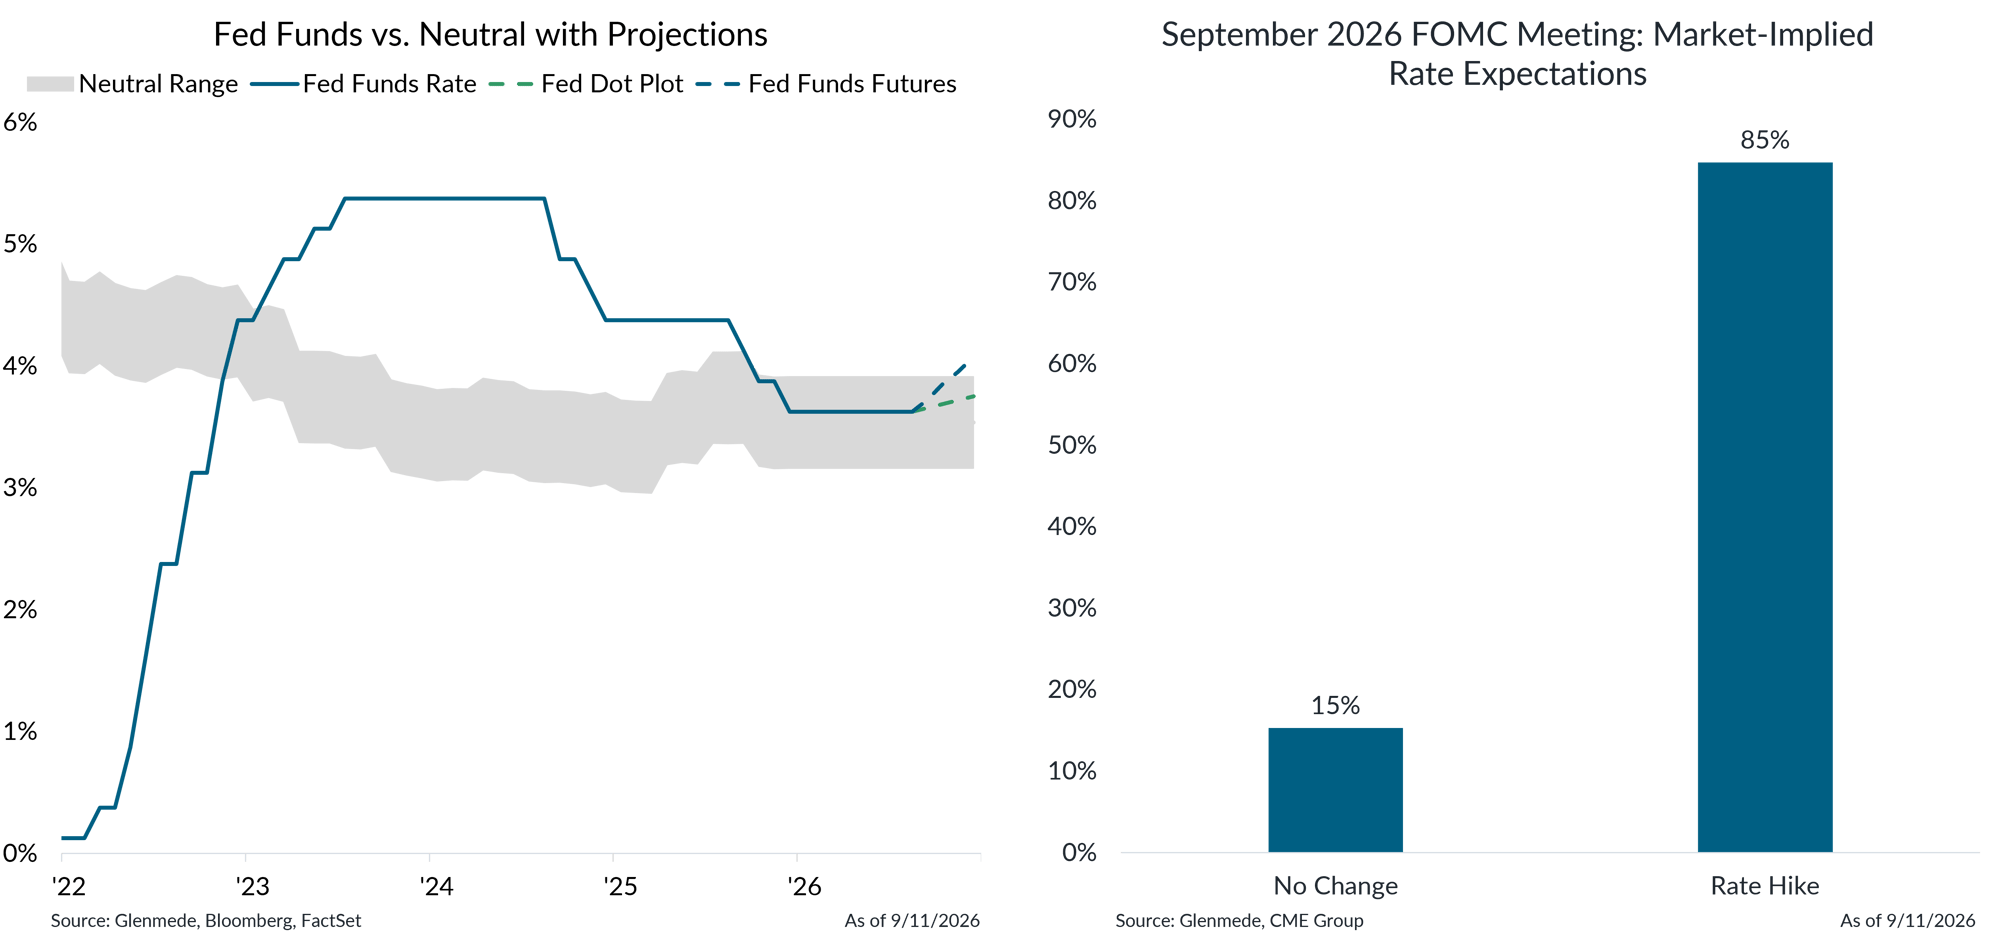
Shown on the left in gray are Glenmede’s range estimates of the neutral federal funds rate over time (i.e., the level of rates that is neither economically stimulative nor restrictive) based on expectations for real interest rates via the Holston-Laubach-Williams model and Glenmede’s inflation expectations. Fed Funds Rate in blue is the target rate midpoint. The dashed blue line represents expectations for the forward path of rates based on fed funds futures pricing. The dashed green line represents expectations for the forward path of rates based on the median respondent in the Federal Open Market Committee’s dot plot projections. Shown on the right are market-implied probabilities for policy rate outcomes at the September 2026 Federal Open Market Committee (FOMC) meeting, derived from federal funds futures prices. Projections and expectations are arrived at in good faith, but actual results may differ materially.
-
Expectations for this week’s FOMC meeting have rapidly repriced following Friday’s inflation report, with market-based probabilities now favoring a rate hike as the most likely, but not quite guaranteed, outcome.
-
Persistent services inflation and a stable labor market may strengthen the Fed's conviction that additional tightening is needed to return inflation to target.
For more in-depth information on this topic, please reach out to your Glenmede Relationship Manager.

This material is provided solely for informational and/or educational purposes and is not intended as personalized investment advice. When provided to a client, advice is based on the client’s unique circumstances and may differ substantially from any general recommendations, suggestions or other considerations included in this material. Any opinions, recommendations, expectations or projections herein are based on information available at the time of publication and may change thereafter. Information obtained from third-party sources is assumed to be reliable but may not be independently verified, and the accuracy thereof is not guaranteed. Any company, fund or security referenced herein is provided solely for illustrative purposes and should not be construed as a recommendation to buy, hold or sell it. Outcomes (including performance) may differ materially from any expectations and projections noted herein due to various risks and uncertainties. Any reference to risk management or risk control does not imply that risk can be eliminated. All investments have risk. Clients are encouraged to discuss any matter discussed herein with their Glenmede representative.