Investment Strategy Brief
A Turning Point for International Equities
April 27, 2025

Executive Summary
- Regional market leadership has historically gone through long, alternating cycles and is perhaps at a key juncture.
- Economic decoupling may lead to a breakdown in correlations between foreign and domestic equities and better diversification.
- Continued dollar weakness could act as a tailwind for international equities, enhancing relative performance for U.S.-based investors.
- International equity valuations remain near fair value and have exhibited less volatility than U.S. counterparts this year.
- The case for international equities in a diversified portfolio has strengthened due to ongoing policy shifts and dollar weakness.
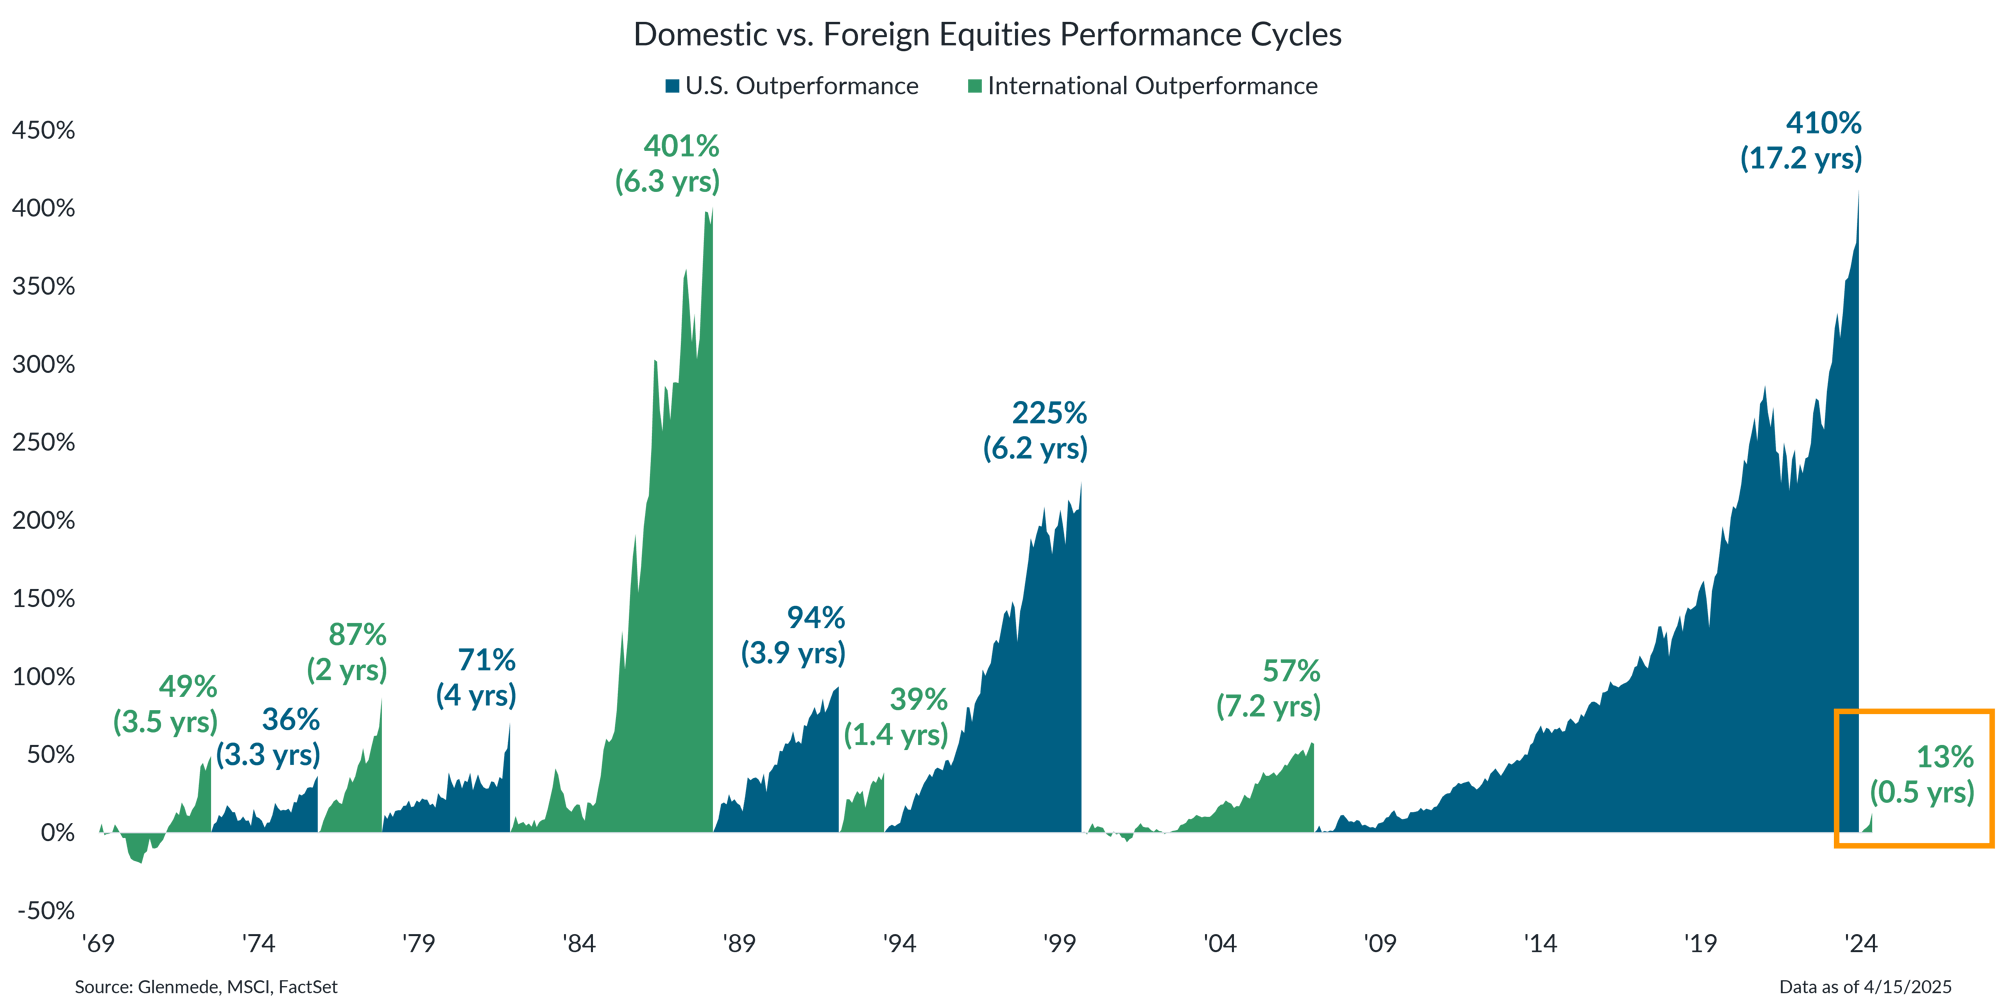
Regional market leadership has historically gone through long, alternating cycles and is perhaps at a key juncture

Data shown is the relative total return performance of U.S. Large Cap (MSCI USA) and International Developed (MSCI EAFE) equities from December 31, 1969. Regime changes are determined when cumulative outperformance peaks and is not reached again in a subsequent 12-month period. Past performance may not be indicative of future results. One cannot invest directly in an index.
- Regional market leadership has gone through long, alternating cycles, recently capped off by a long outperformance cycle for U.S. stocks.
- However, the script may be starting to flip, as domestic equities have struggled this year while international markets have performed well in comparison.
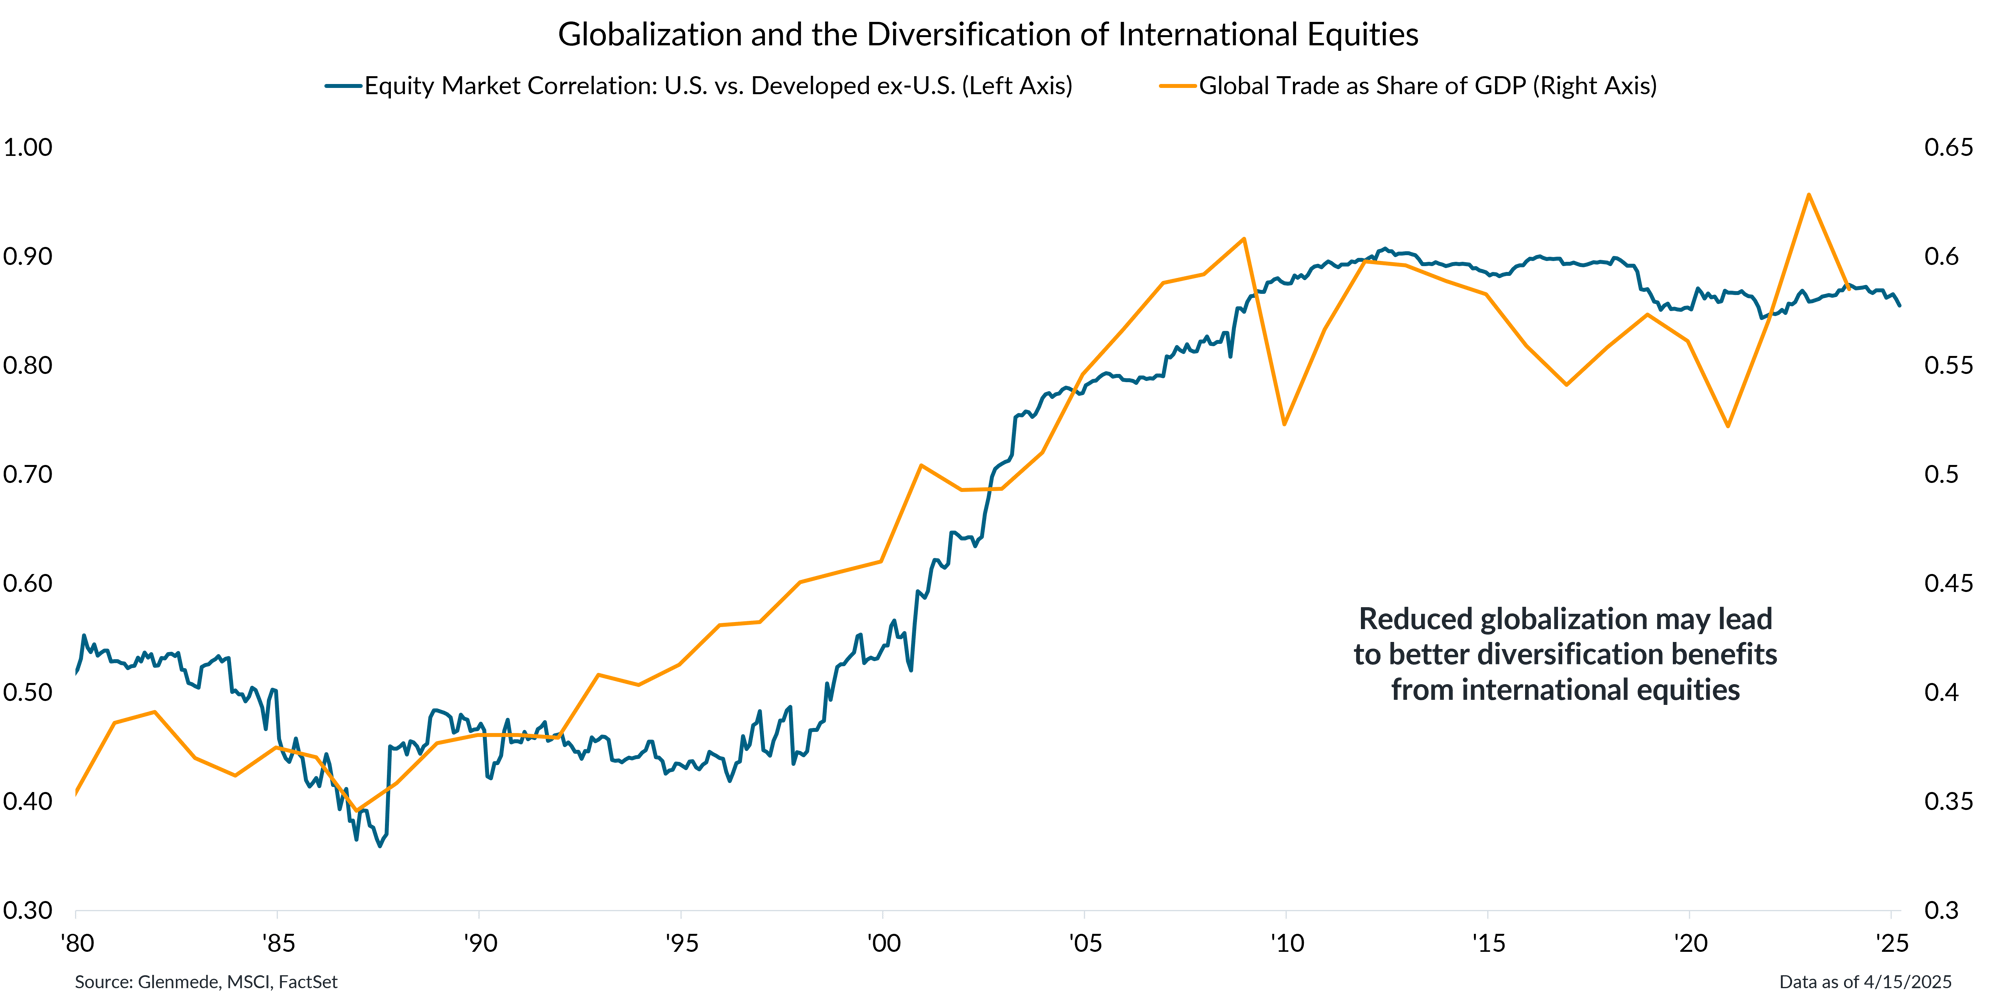
Economic decoupling may lead to a breakdown in correlations between foreign and domestic equities

Data shown in blue and graphed along the left y-axis is the rolling 10-year correlation between the S&P 500 and MSCI EAFE indexes, with total returns measured in U.S. dollar terms. Shown in orange and graphed along the right y-axis is global trade as a share of gross domestic product (GDP). Past performance may not be indicative of future results. One cannot invest directly in an index.
- Only a few decades ago, domestic and foreign markets behaved quite differently (i.e., lower correlations). As globalization proliferated, most global markets became much more correlated.
- A shift toward economic decoupling, prompted by recent trade policies, may create greater diversification opportunities in international equities as markets become less interconnected.
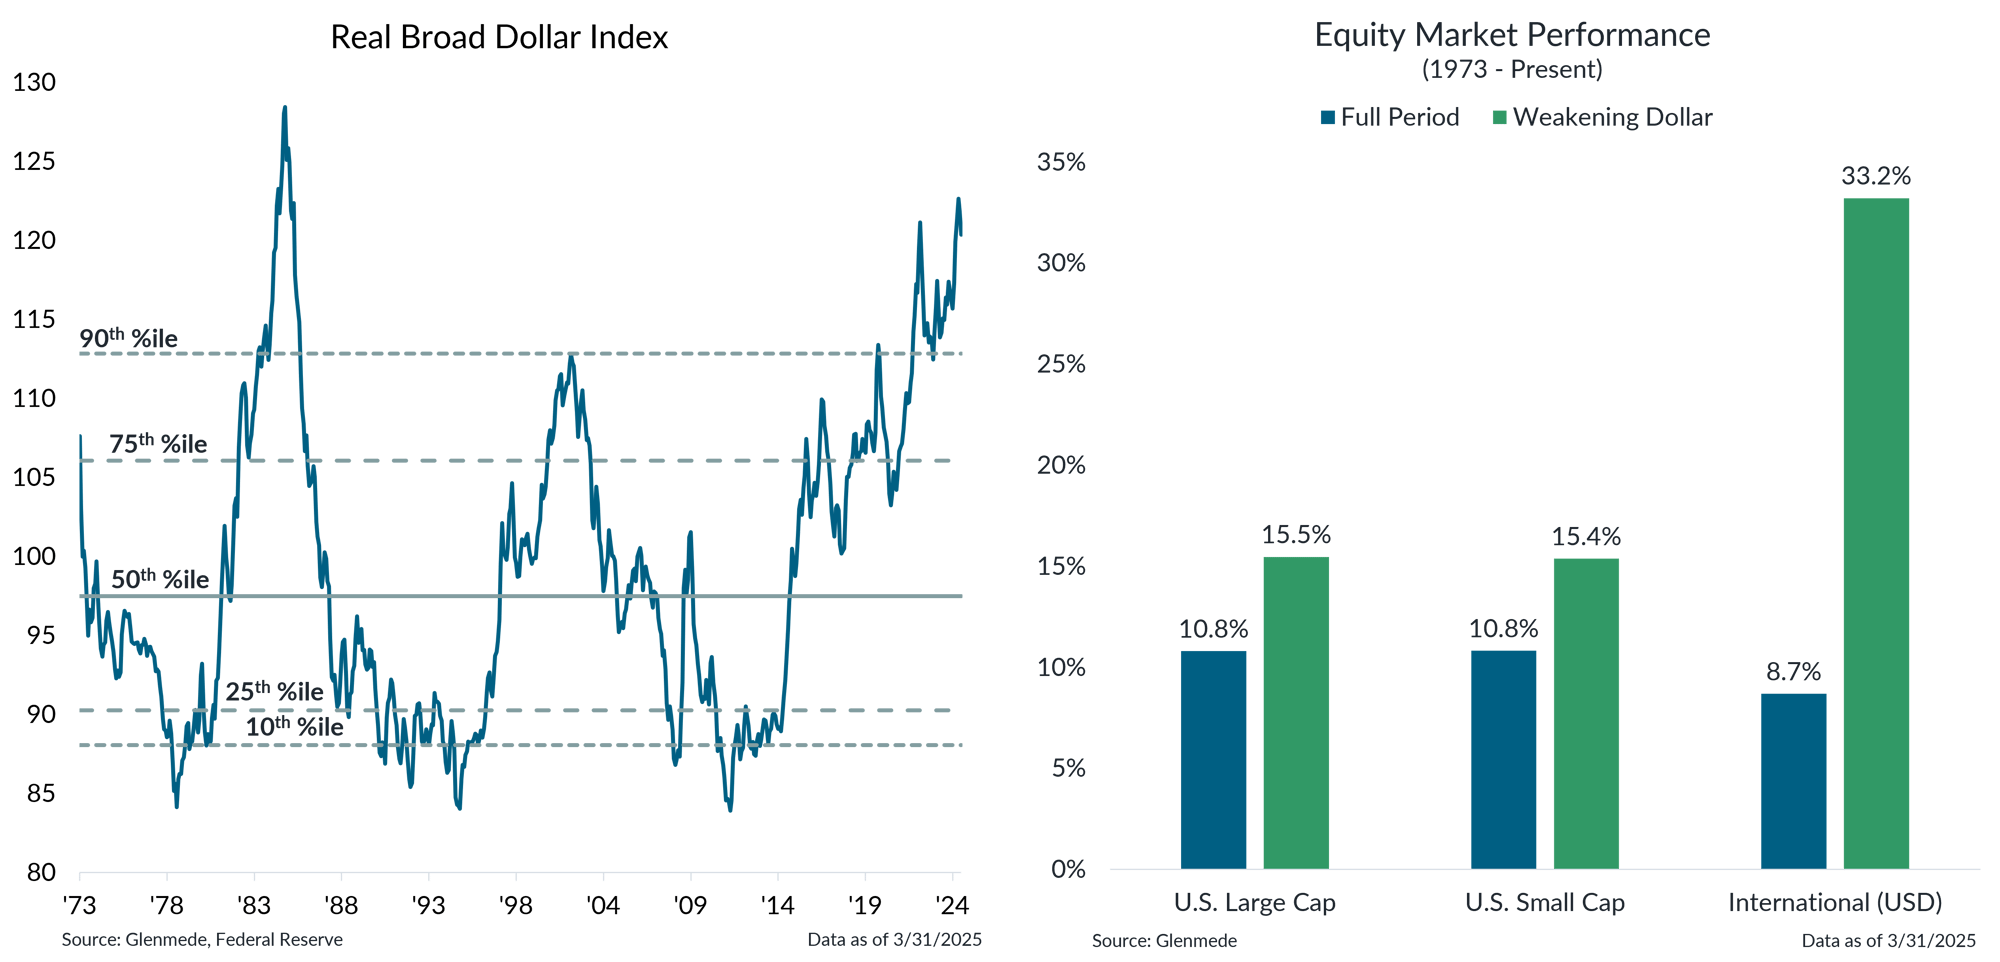
Further dollar weakness could be a tailwind for international equities

Data shown in the left panel are weighted averages of the foreign exchange value of the U.S. dollar against the currencies of a broad group of major U.S. trading partners, adjusted for inflation to account for purchasing power differentials. Shown in the right panel is the annualized performance of U.S. Large Cap (S&P 500 Index), U.S. Small Cap (Russell 2000 Index) and International (MSCI All Country World ex-U.S., backfilled prior to 1988 with the MSCI EAFE Index) equities since 1973 in blue, and the performance of each over the same period including only the months when the U.S. dollar was weakening in green. Past performance may not be indicative of future results. One cannot invest directly in an index.
- Recent dollar weakness has been driven by shifting trade policies and uncertainties regarding the future trajectories of economic growth, inflation and government policies.
- This trend is expected to benefit international equities by improving returns through more favorable currency exchange effects for U.S.-based investors.
International equities remain near fair value, having seen less volatility than U.S. counterparts this year

Data shown are Glenmede’s estimates of long-term fair value for U.S. Large Cap (MSCI USA), U.S. Small Cap (MSCI USA Small), International (MSCI ACWI ex USA), Europe (MSCI Europe), Japan (MSCI Japan) and Emerging Markets (MSCI EM) based on normalized earnings, normalized cash flows, dividend yield and book value for each index. Blue dots represent current valuation levels and purple dots represent valuation levels at the beginning of 2025. Glenmede’s estimates of fair value are arrived at in good faith, but longer-term targets for valuation may be uncertain. One cannot invest directly in an index.
- Valuations across international equities, including Europe and emerging markets, remain near fair value, while Japan remains at a notable discount.
- Valuations in international markets have remained relatively stable, in contrast to the U.S., where previously elevated valuations have come down notably this year.
- The case for international equities in a diversified portfolio has strengthened due to ongoing policy shifts and dollar weakness.
This material is intended to review matters of possible interest to Glenmede Trust Company clients and friends and is not intended as personalized investment advice. When provided to a client, advice is based on the client’s unique circumstances and may differ substantially from any general recommendations, suggestions or other considerations included in this material. Any opinions, recommendations, expectations or projections herein are based on information available at the time of publication and may change thereafter. Information obtained from third-party sources is assumed to be reliable but may not be independently verified, and the accuracy thereof is not guaranteed. Outcomes (including performance) may differ materially from any expectations and projections noted herein due to various risks and uncertainties. Any reference to risk management or risk control does not imply that risk can be eliminated. All investments have risk. Clients are encouraged to discuss any matter discussed herein with their Glenmede representative.

Feature one
Use text and images to tell your company’s story. Explain what makes your product or service extraordinary.

Feature two
Use text and images to tell your company’s story. Explain what makes your product or service extraordinary.

Feature three
Use text and images to tell your company’s story. Explain what makes your product or service extraordinary.

