Investment Strategy Brief
An AI Lesson in Concentration Risks
February 3, 2025
Executive Summary
- Nvidia logged the largest single-day loss of market cap in history, which is a case in point for the dangers of market concentration.
- DeepSeek has upended assumptions regarding costs and hardware requirements for building effective AI.
- Last week’s news is a reminder of the risks that the largest companies face from competitive and regulatory disruption.
- The market’s recent lesson on AI disruption should prompt investors to favor investment processes.
Equity markets in 2025 so far are a case in point for the dangers of excessive market concentration
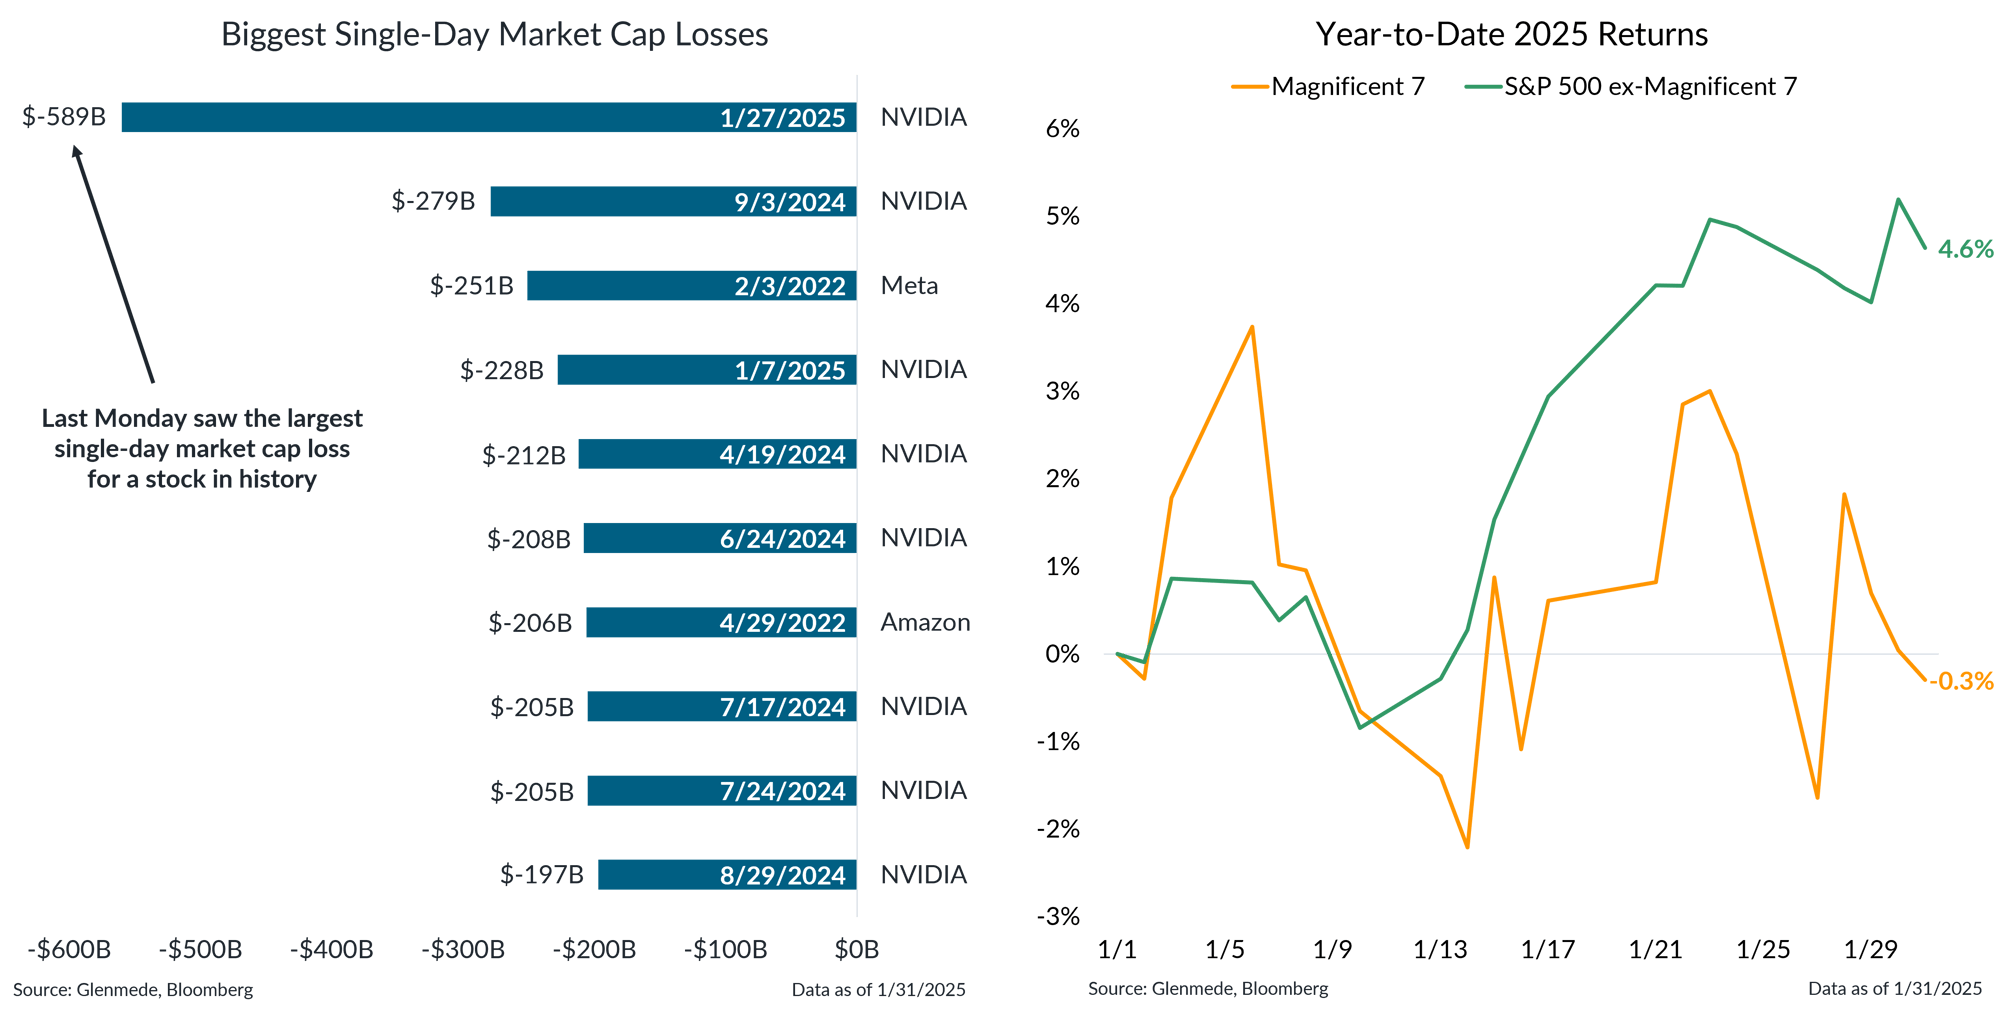
Data shown in the left panel are the ten largest single-day losses for global publicly-traded stocks, as measured by market capitalization. Data shown in the right panel are year-to-date (2025) returns for the Magnificent 7 (Apple, Alphabet, Amazon, Meta, Microsoft, Nvidia, Tesla) in yellow and the S&P 500 excluding those stocks in green. The S&P 500 is a market capitalization weighted index of large cap stocks in the U.S. Past performance may not be indicative of future results. References to individual stocks should not be construed as a recommendation to buy, hold or sell. One cannot invest directly in an index.
- The unveiling of DeepSeek’s new AI model, reportedly created at a fraction of the cost of competitors, prompted the largest single-day market capitalization loss for a stock in market history from Nvidia.
- After a strong showing over the past few years, the Magnificent 7 is off to a not-so-magnificent start to 2025, with the rest of the S&P 500 delivering better returns so far.
DeepSeek has upended assumptions regarding costs and hardware requirements for building effective AI
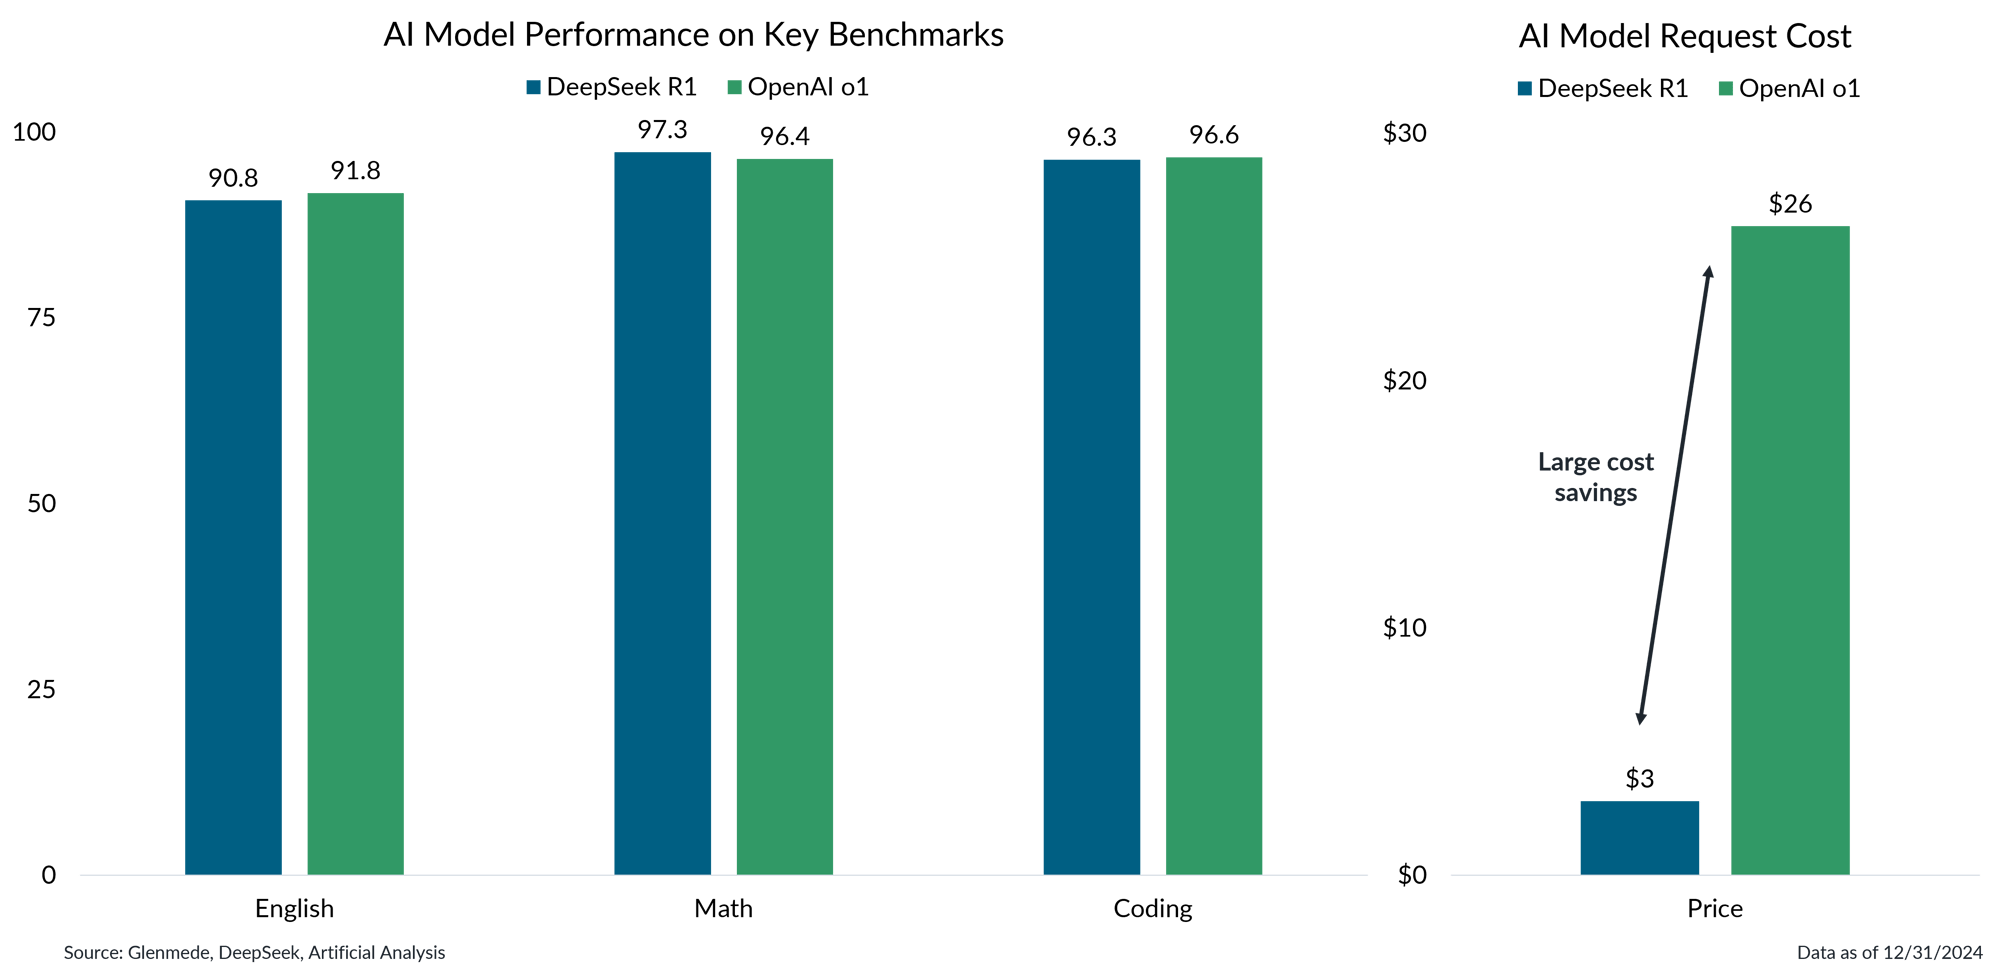
Data shown are key metrics relevant to artificial intelligence large language models for DeepSeek’s R1 model (in blue) and OpenAI’s o1 model (in green). English scores are measured via the Massive Multitask Language Understanding (MMLU) benchmark, Math scores are measured via the Math500 mathematical reasoning benchmark, Coding scores are measured via the Codeforces Competitive Programming Platforms benchmark and Price is measured as a three-to-one ratio of the price in U.S. dollars charged by model providers per million input and output tokens. Tokens are numerical representations of words and characters that large language models take as inputs and outputs. Information from third-party sources is assumed to be reliable but its accuracy is not guaranteed.
- DeepSeek has developed an AI model that it claims is competitive with industry leaders at a fraction of the cost.
- This has led the market to reassess the business proposition for cutting edge computer chip technology, especially since DeepSeek reports to have trained its model with much less powerful hardware than previously thought possible.
Competitive and regulatory disruption has made it difficult for any firm to remain in the top five
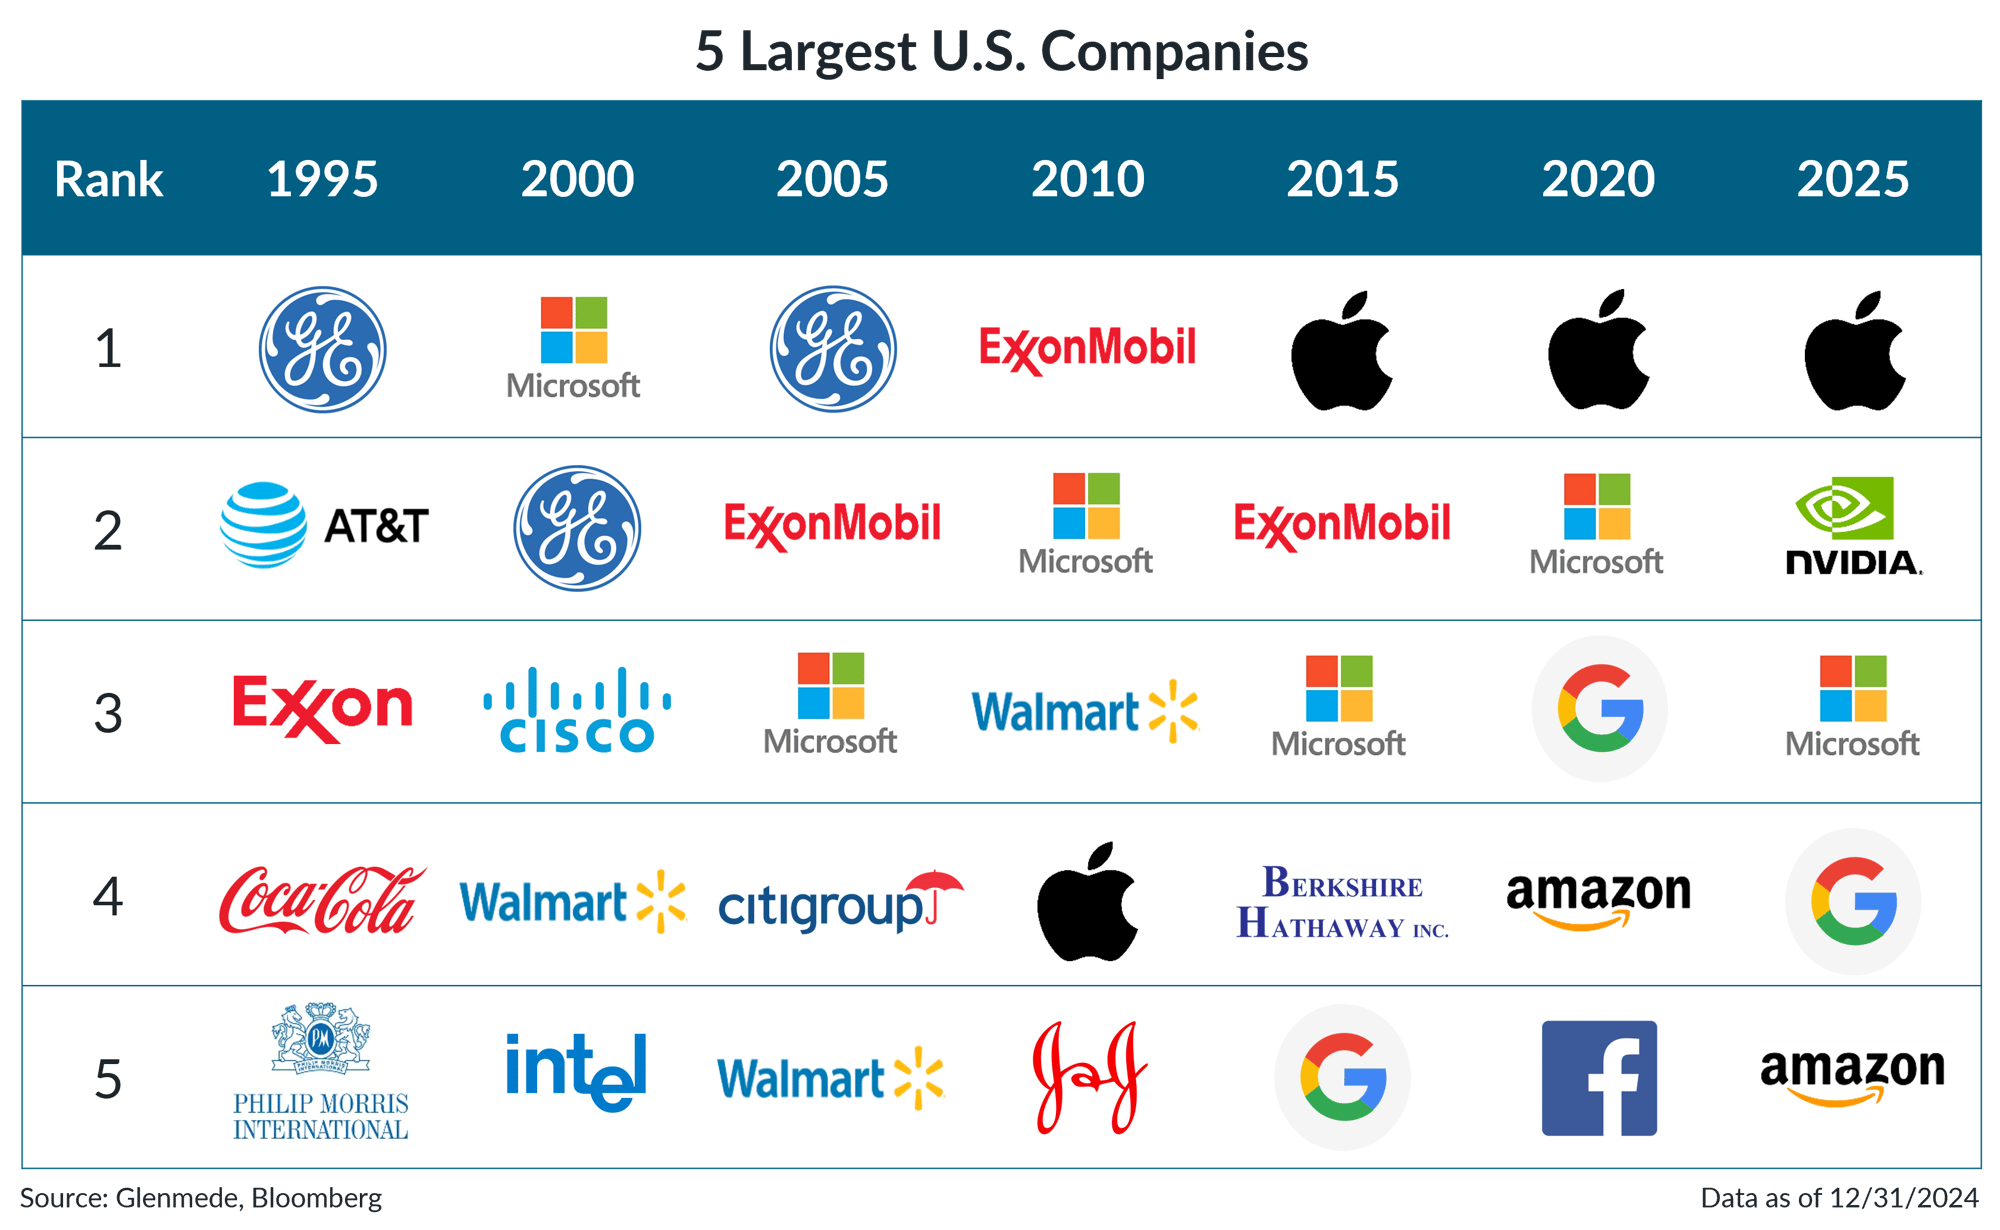
Data shown are the five largest companies in the S&P 500 index as measured by market capitalization, as of the last day of each year shown. The S&P 500 is a market capitalization weighted index of large cap stocks in the U.S. Past performance may not be indicative of future results. References to individual stocks should not be construed as a recommendation to buy, hold or sell. One cannot invest directly in an index.
- The leaderboard of the largest public companies in the U.S. has shifted through the decades, reflecting changes in industry leadership, innovation and market dynamics.
- It is difficult to predict which companies will remain at the top, especially since the largest firms tend to be targets for competitive and regulatory disruption, leading to turnover at the top.
It pays to maintain a diversified approach in top-heavy markets over the long-run
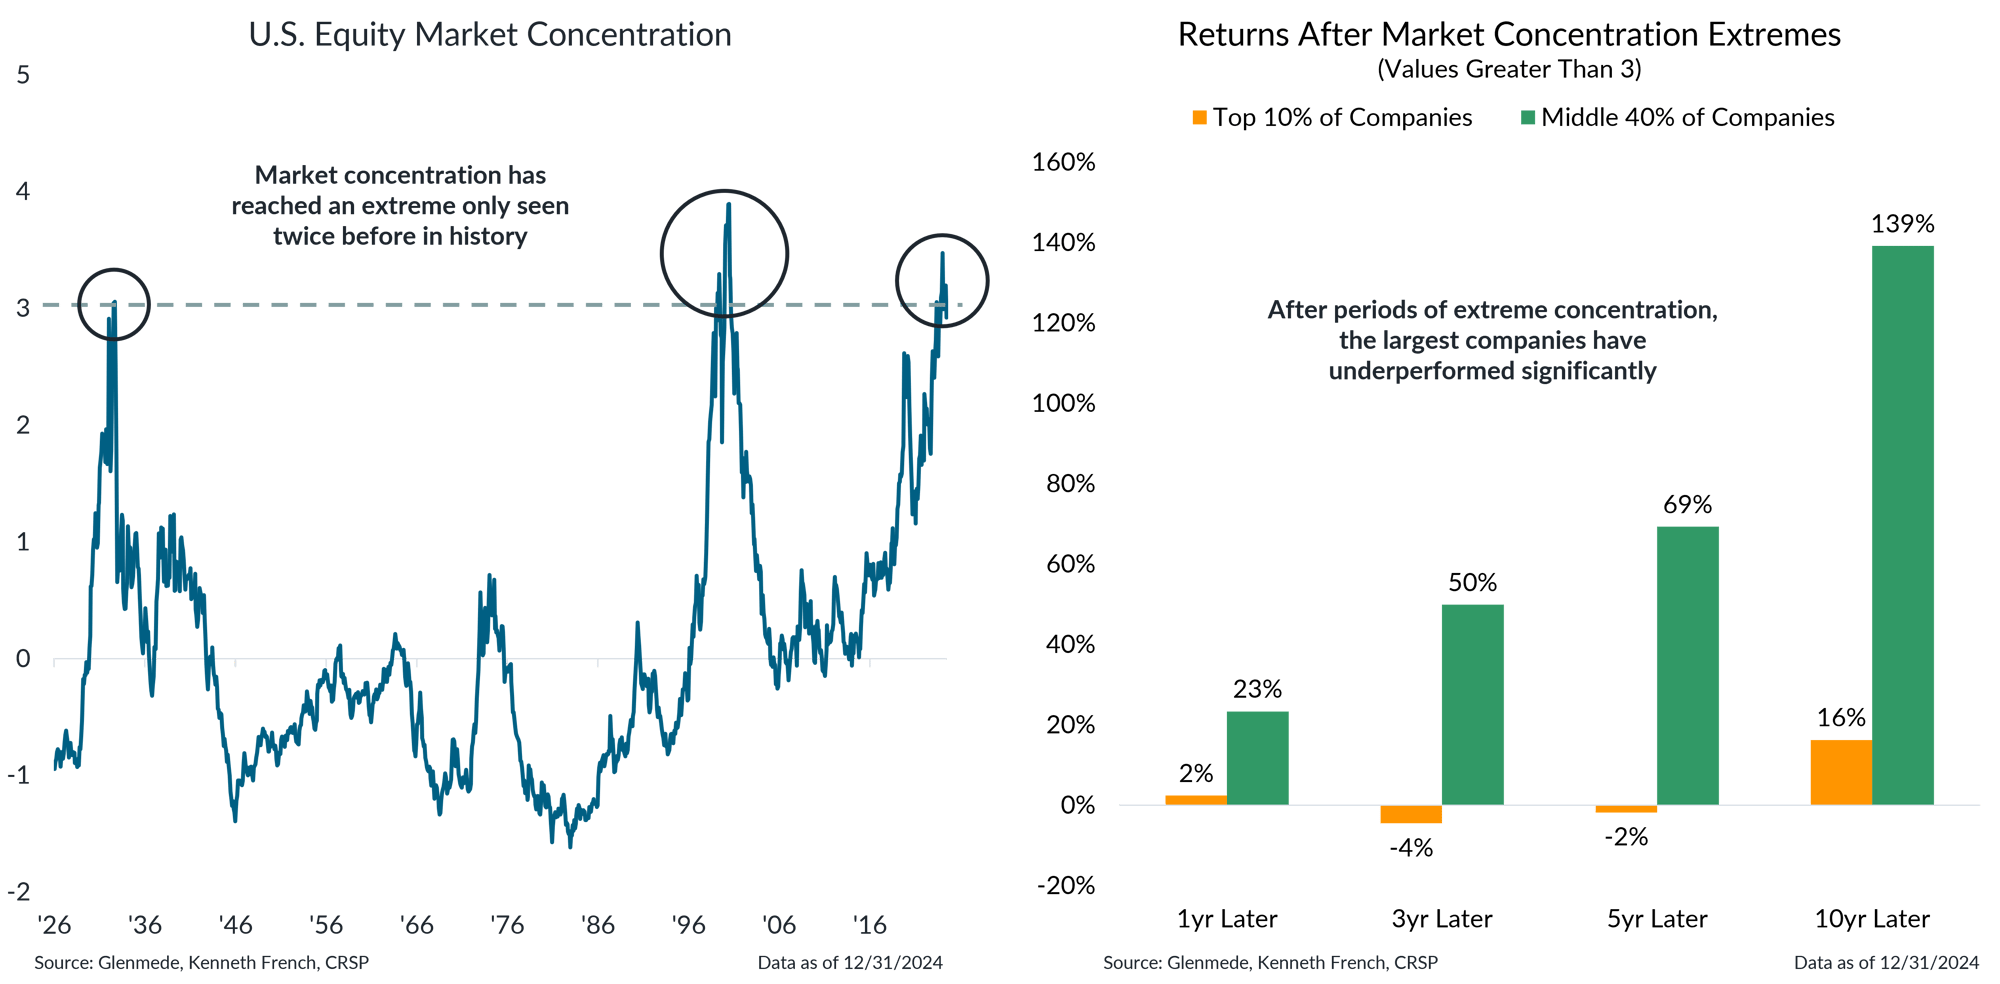
Data shown in the left panel is a measure of equity market concentration defined as the average firm size in the top decile of companies in the Center for Research in Security Prices (CRSP) database divided by the average firm size across the middle 40% of companies. The data graphed represent the number of standard deviations from the mean of this quotient. Data shown in the right panel are ex-post, cumulative value-weighted total returns for the following 1-, 3-, 5- and 10-year periods after the measure of equity market concentration eclipses 3 for the top decile of companies and the middle 40% of companies in the database. Past performance may not be indicative of future results.
- U.S. market concentration has reached extreme levels, with the largest companies now commanding a dominant share of the market consistent with only two other periods in history since the 1920s.
- The market’s recent lesson on AI disruption should prompt investors to favor investment processes that lean against market concentration.
This material is intended to review matters of possible interest to Glenmede Trust Company clients and friends and is not intended as personalized investment advice. When provided to a client, advice is based on the client’s unique circumstances and may differ substantially from any general recommendations, suggestions or other considerations included in this material. Any opinions, recommendations, expectations or projections herein are based on information available at the time of publication and may change thereafter. Information obtained from third-party sources is assumed to be reliable but may not be independently verified, and the accuracy thereof is not guaranteed. Outcomes (including performance) may differ materially from any expectations and projections noted herein due to various risks and uncertainties. Any reference to risk management or risk control does not imply that risk can be eliminated. All investments have risk. Clients are encouraged to discuss any matter discussed herein with their Glenmede representative.

Feature one
Use text and images to tell your company’s story. Explain what makes your product or service extraordinary.

Feature two
Use text and images to tell your company’s story. Explain what makes your product or service extraordinary.

Feature three
Use text and images to tell your company’s story. Explain what makes your product or service extraordinary.

