Investment Strategy Brief
Artificial Intelligence: Capex or Cap-Excess?
October 20, 2025
Executive Summary
- The Mag 7 spend more on capex than any top 7 stocks in history, a trend industry analysts expect to persist.
- The network buildout in the late 90s is a cautionary tale of a big capex cycle that misjudged demand.
- Today’s AI buildout is led by fundamentally stronger firms, but the investments are occurring in assets with shorter useful lives.
- Investing around innovation cycles can be bumpy, and long-term beneficiaries are difficult to predict.
- Investors should exercise caution chasing the AI innovation theme amid extreme levels of tech concentration in major indices.
The Mag 7 now spend more on capex than any top 7 in history, a trend industry analysts expect to persist
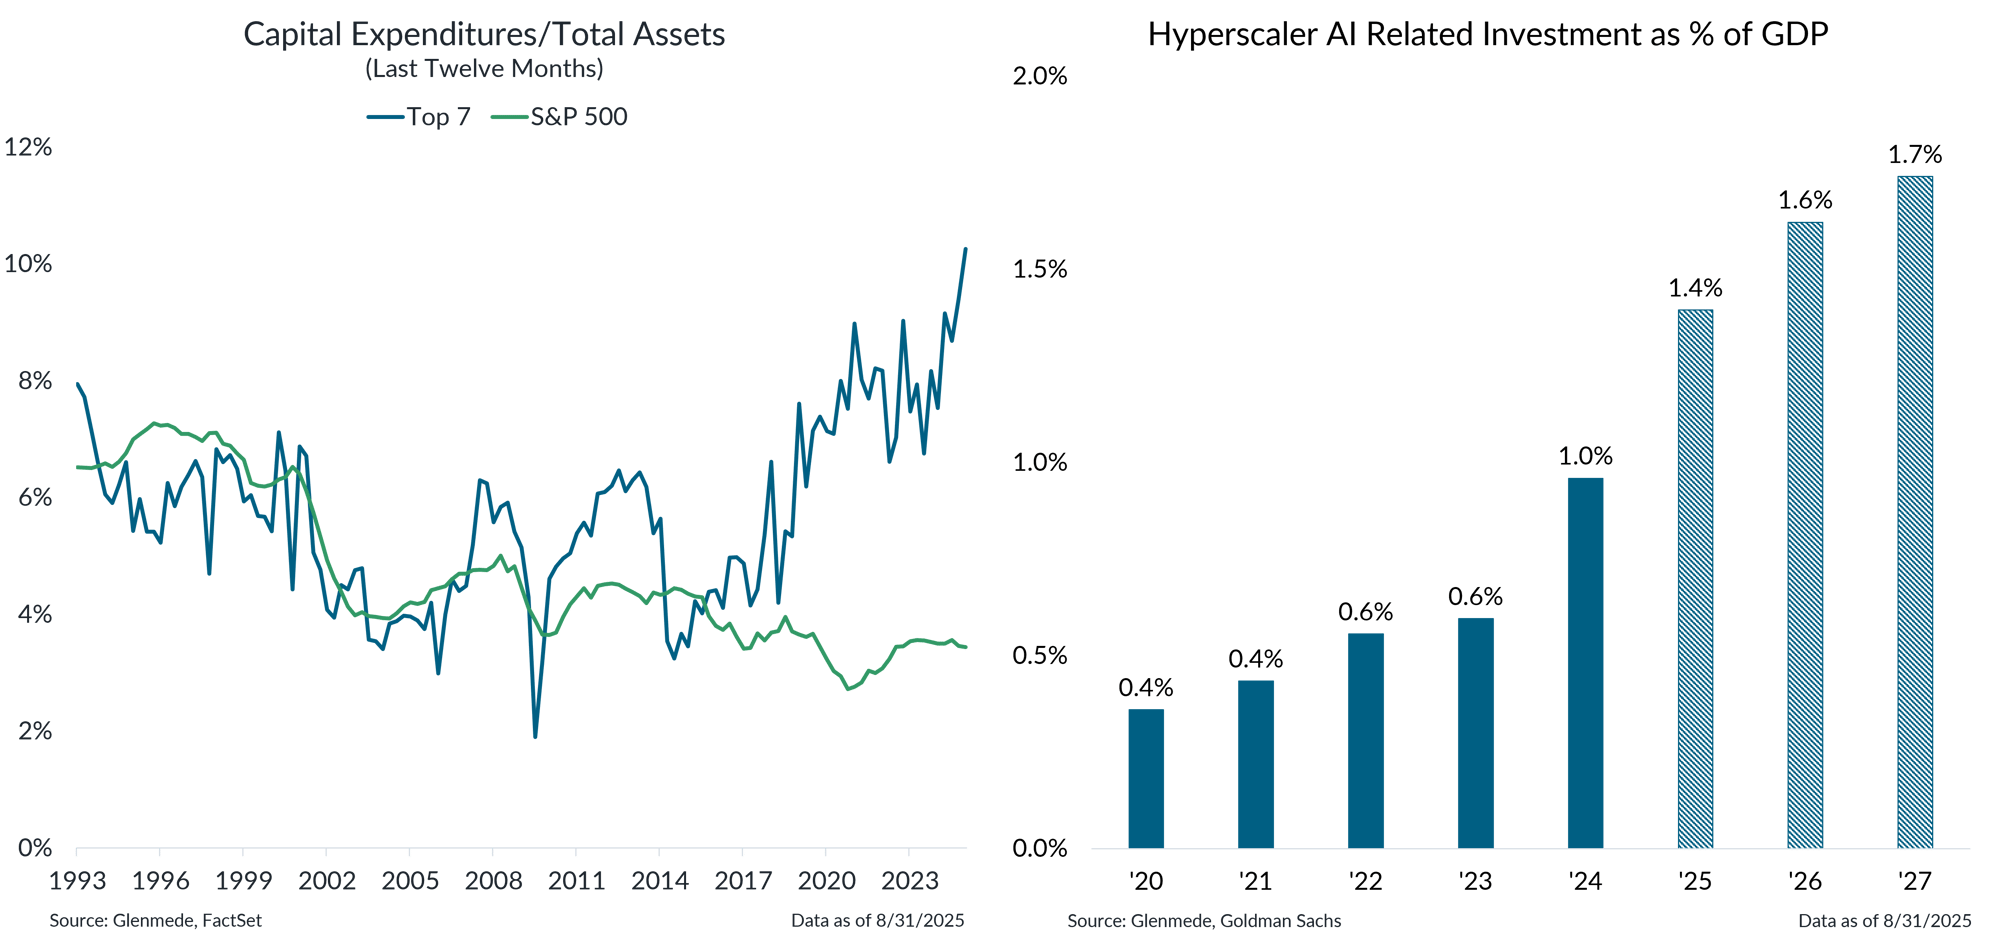
Data shown in the left panel represent average capital expenditures as a share of total assets, measured on a last-12-months basis, for two groups of stocks: the largest seven companies in the S&P 500 at each point in time (blue) and all index constituents (green). Both lines reflect equally weighted averages of their respective groups. Data shown in the right panel are the total capital expenditures from Oracle, Meta, Google, Amazon, and Microsoft as a share of U.S. gross domestic product (GDP). Solid bars represent actual figures while hashed bars represent projections. This visual should not be interpreted as a recommendation to buy, hold, or sell any specific securities. Past performance may not be indicative of future results. One cannot invest directly in an index. Actual results may differ materially from expectations.
- A big part of the Mag 7’s rise to dominance has been their history of running asset light, low capex intensity business models.
- That characterization of these businesses has changed over the past year. The Mag 7 are now deploying capital expenditures at a rate well beyond prior market leaders and are expected to continue that trend around the buildout of AI capabilities.
The network buildout in the late 90s is a cautionary tale of a big capex cycle that misjudged demand
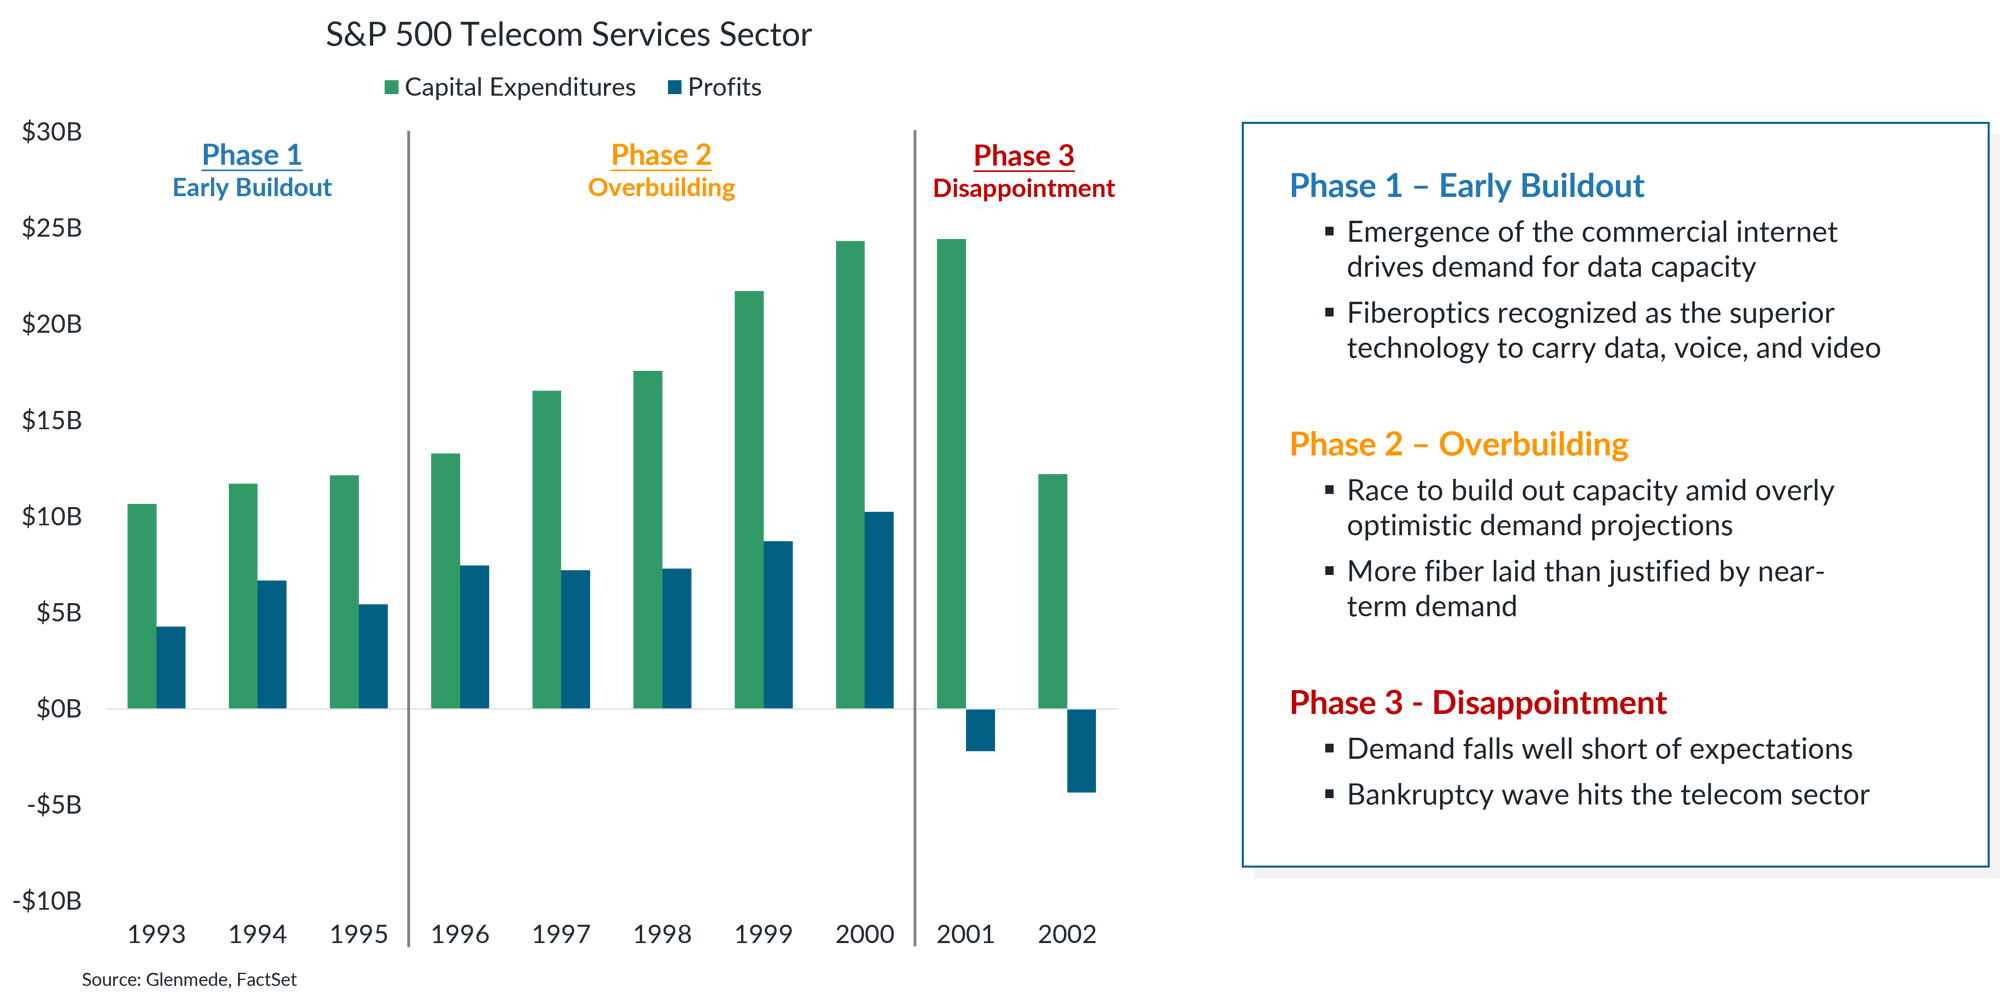
Data shown in the left panel are the aggregate capital expenditures (green) and net income excluding extraordinary items (blue) in billions of U.S. dollars for the S&P 500’s telecommunications services sector. The S&P 500 is a market capitalization weighted index of U.S. large cap stocks. Past performance may not be indicative of future results. One cannot invest directly in an index.
- Telecom companies aggressively built out fiberoptic network infrastructure in the late 90s in anticipation of explosive internet demand that ultimately failed to materialize.
- The mismatch between capacity and demand led to collapsing profits, widespread bankruptcies, and disappointing returns for investors, offering a reminder of how capex booms can overshoot real economic needs.
Today's AI buildout is led by stronger firms, but chips, unlike fiber, quickly become obsolete
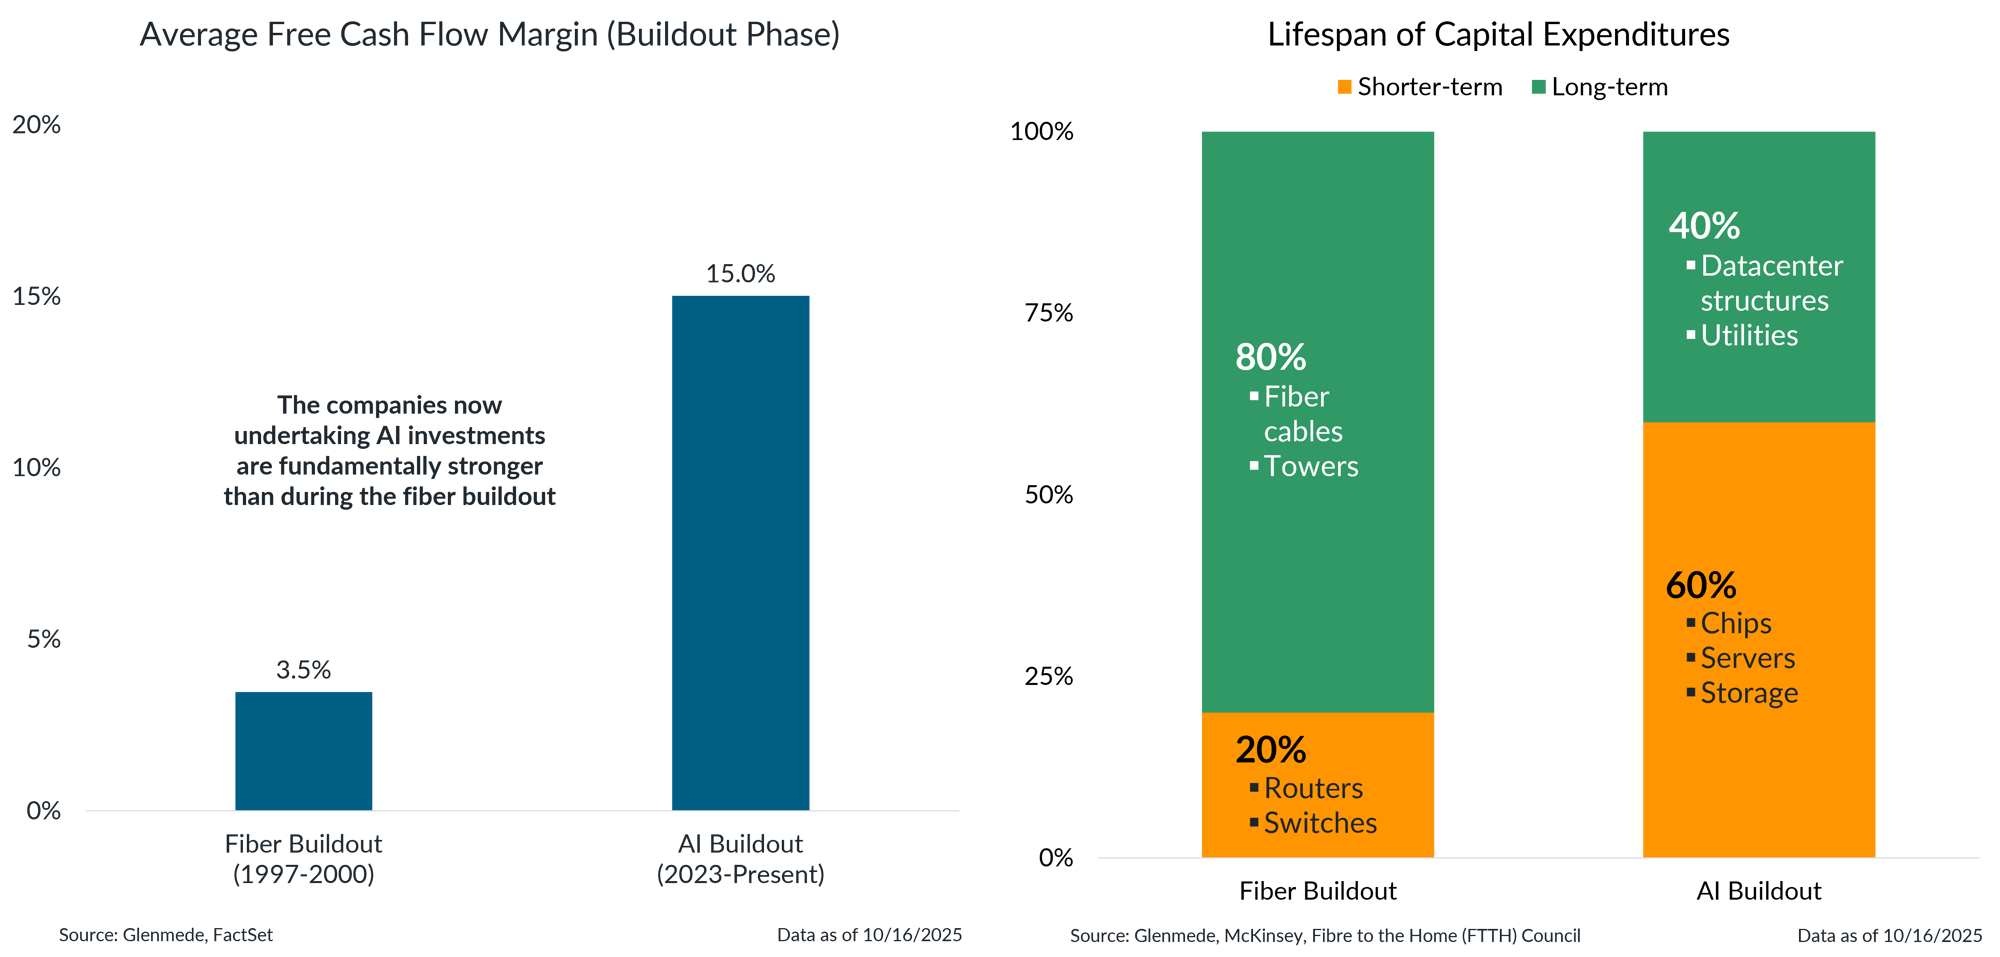
Data shown in the left panel are the average free cash flow margins for the fiber buildout (S&P 500’s telecommunications services sector from 1997 through 2000) and the AI buildout (Oracle, Meta, Google, Amazon, and Microsoft from 2023 to present). Data shown in the right panel are a general overview of the lifespan of the various costs for building fiberoptic infrastructure and datacenters. The S&P 500 is a market capitalization weighted index of U.S. large cap stocks. This visual should not be interpreted as a recommendation to buy, hold, or sell any specific securities. Past performance may not be indicative of future results. One cannot invest directly in an index. Actual results may differ materially from estimates.
- This AI capex cycle has a few key differences to the buildout of fiberoptic networks. The companies now undertaking AI investments are doing so on top of fundamentally stronger underlying business models than during the fiber buildout.
- However, the investments being deployed may have shorter useful lives. While most fiber laid in the 90s remains in service, computer chips quickly become obsolete and demand constant replacement.
Investing around innovation cycles can be bumpy, and long-term beneficiaries are difficult to predict
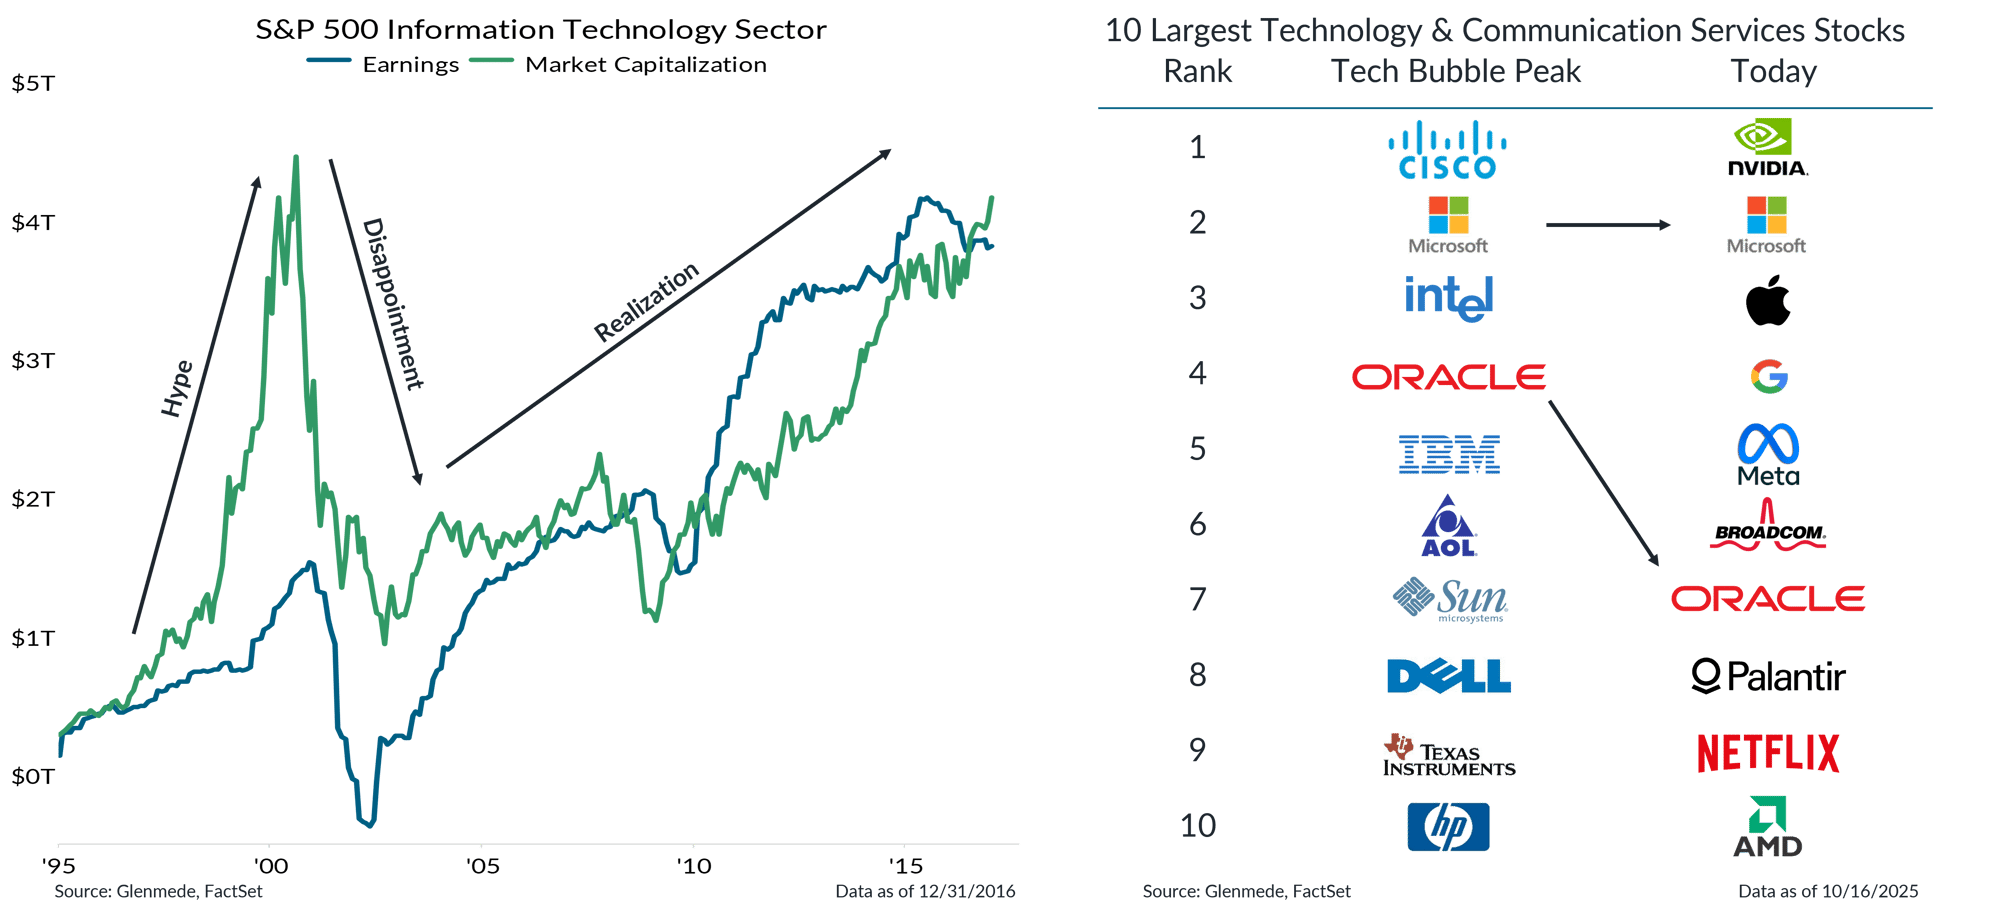
Shown in the left panel are the earnings and market capitalization of the S&P 500 Index’s information technology sector. S&P 500 Information Technology Earnings is an estimate of market value based on net income capitalized at a rate of 20 times earnings. Shown in the right panel are the 10 largest stocks in the S&P 500 classified in the information technology and communication services sectors at the Tech Bubble’s peak on March 27, 2000 and as of the latest date shown. Arrows denote the stocks that were in the top 10 during both periods. The S&P 500 and its sector-specific sub-indices are market capitalization weighted indices of U.S. large cap stocks. This visual should not be interpreted as a recommendation to buy, hold, or sell any specific securities. Past performance may not be indicative of future results. One cannot invest directly in an index.
- During the late 90s tech boom, valuations surged ahead of fundamentals amid investor hype. Although the earnings did eventually catch up, near-term overexuberance was shortly followed by significant downside in asset prices.
- It is not always easy to identify which companies will be the longer-term beneficiaries of innovation. For example, of the top 10 tech and communications firms at the turn of the millennium, only two remain today.
Seven U.S. stocks eclipse the full investable markets of Japan and Europe
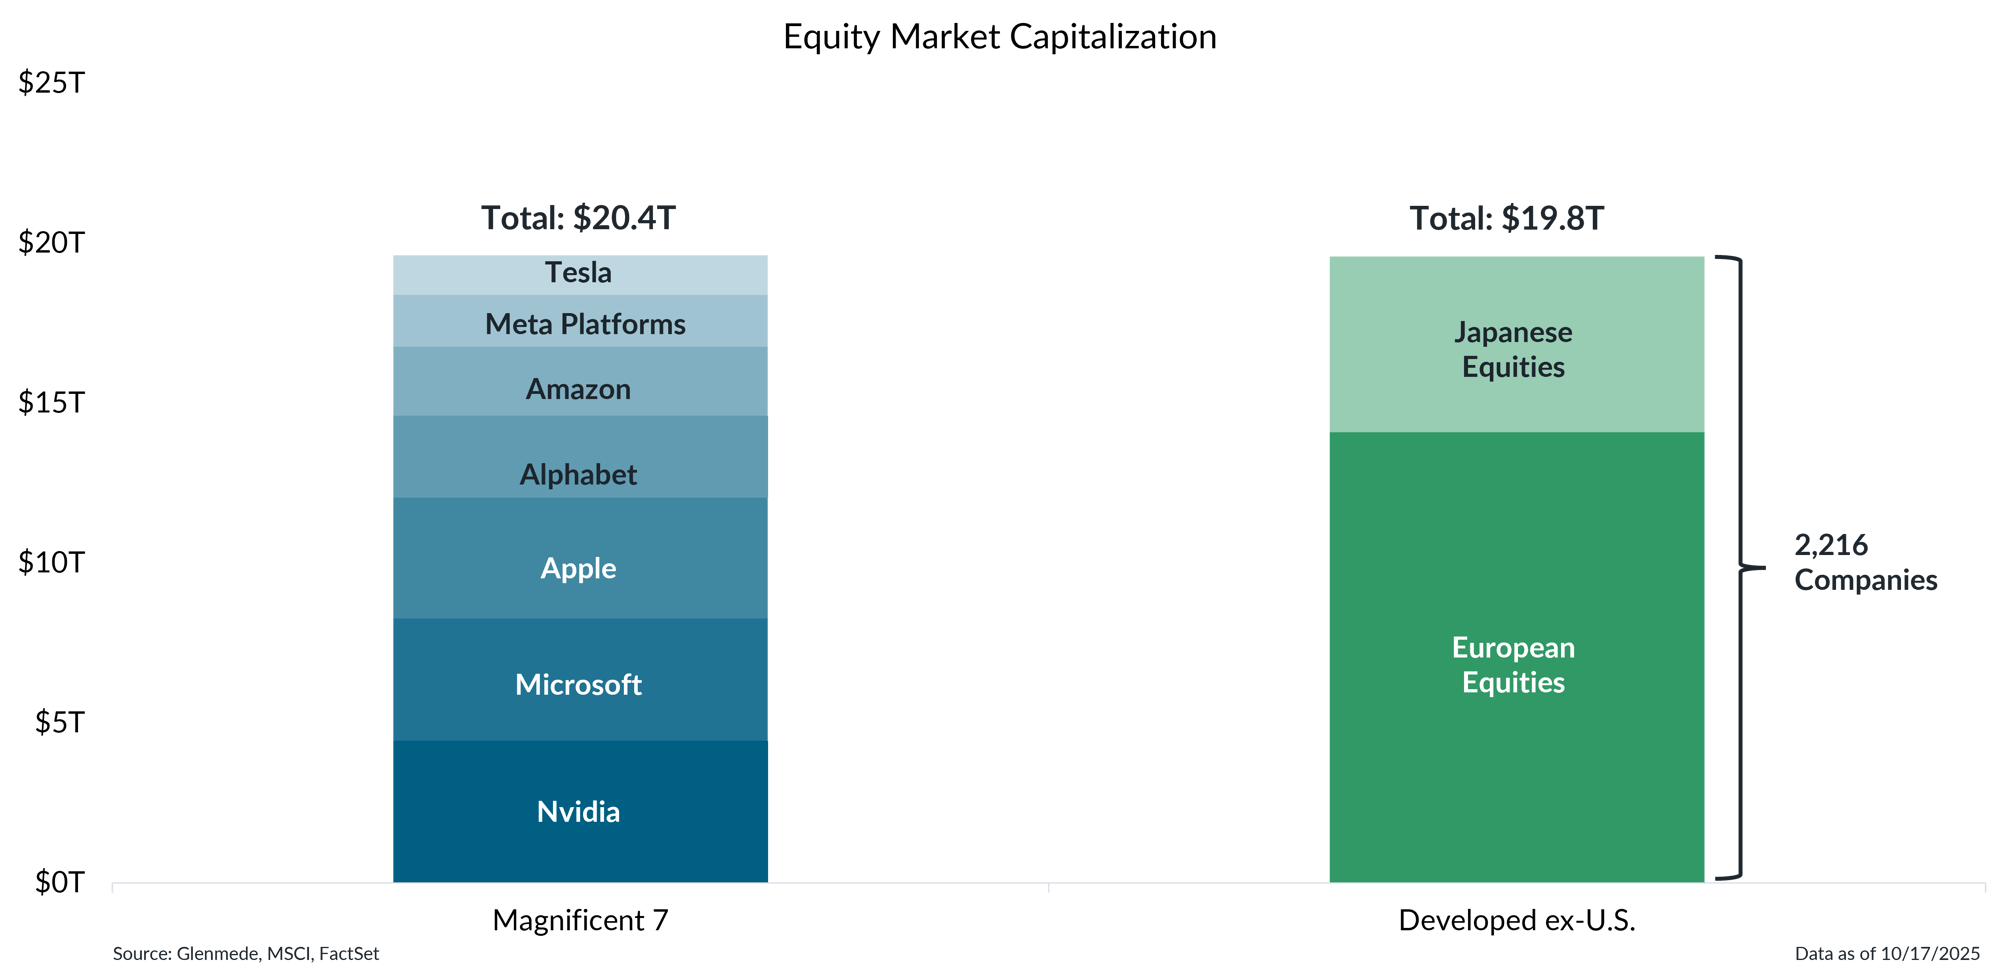
Data shown are market capitalizations in U.S. dollars for the Mag 7 (Nvidia (NVDA), Apple (AAPL), Microsoft (MSFT), Alphabet (GOOG & GOOGL), Amazon (AMZN), Meta Platforms (META), and Tesla (TSLA)). Japanese equities and European equities are represented by the MSCI Investable Market Index (IMI) for each region, which captures large, mid, and small cap securities covering roughly 99% of each market’s free-float adjusted capitalization. This visual should not be interpreted as a recommendation to buy, hold, or sell any specific securities. Past performance may not be indicative of future results. One cannot invest directly in an index.
- Levels of concentration in U.S. equity markets continue to hit new extremes. For example, the combined value of the Mag 7 now eclipses the entirety of the European and Japanese equity markets.
- Investors should exercise caution chasing recent winners, as the promises of innovation are never guaranteed and concentration risks could intensify if demand falls short of expectations.
This material is provided solely for informational and/or educational purposes and is not intended as personalized investment advice. When provided to a client, advice is based on the client’s unique circumstances and may differ substantially from any general recommendations, suggestions or other considerations included in this material. Any opinions, recommendations, expectations or projections herein are based on information available at the time of publication and may change thereafter. Information obtained from third-party sources is assumed to be reliable but may not be independently verified, and the accuracy thereof is not guaranteed. Any company, fund or security referenced herein is provided solely for illustrative purposes and should not be construed as a recommendation to buy, hold or sell it. Outcomes (including performance) may differ materially from any expectations and projections noted herein due to various risks and uncertainties. Any reference to risk management or risk control does not imply that risk can be eliminated. All investments have risk. Clients are encouraged to discuss any matter discussed herein with their Glenmede representative.

