Investment Strategy Brief
Assessing the U.S. Equity Market Correction
March 16, 2025

Executive Summary
- Drawdowns of 10%+ are relatively common, occurring on average every 1-2 years amid shifting expectations and risks.
- Market weakness appears localized to the U.S., with international equities providing a diversification benefit.
- The decline appears tied to uncertainty among businesses and consumers amid recent dramatic policy shifts.
- Economic growth expectations for the first half of 2025 have been revised lower, but recession is not the base case.
- The uncertainty-driven correction provides an opportunity to rebalance to long-term policies, adding to equities at lower prices.
Market corrections are common, occurring on average every 1-2 years amid shifting expectations and risks
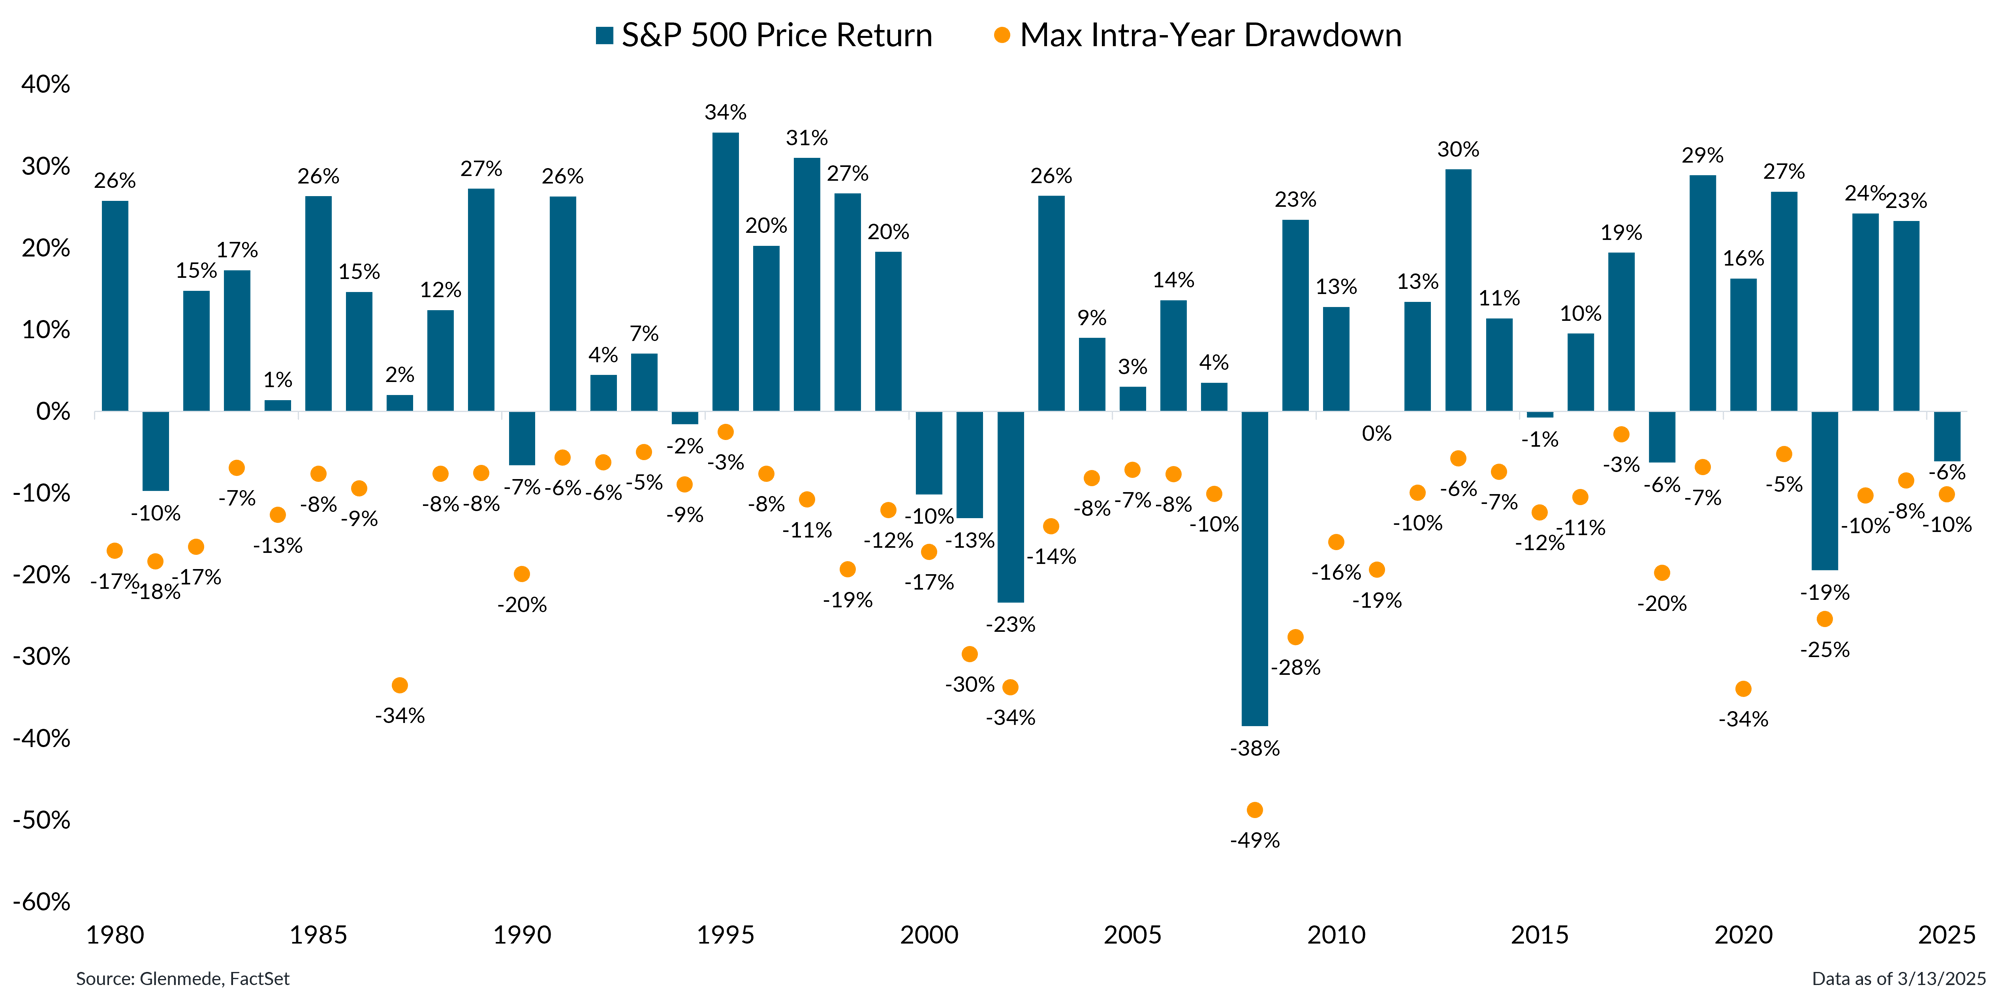
Data shown are returns based on the price index only and the max intra-year drawdown, referring to the largest intra-year drop. The S&P 500 is a market capitalization weighted index of large cap stocks. Past performance may not be indicative of future results. One cannot invest directly in an index.
- Uncertainty surrounding the impact of tariffs on economic growth has led to a market correction with the S&P 500 declining 10% from its all-time high.
- Drawdowns of this magnitude are common and normal—U.S. equities have experienced drawdowns of 10% or more in 57% of calendar years since 1927.
Market weakness appears localized to the U.S., with international equities providing a diversification benefit
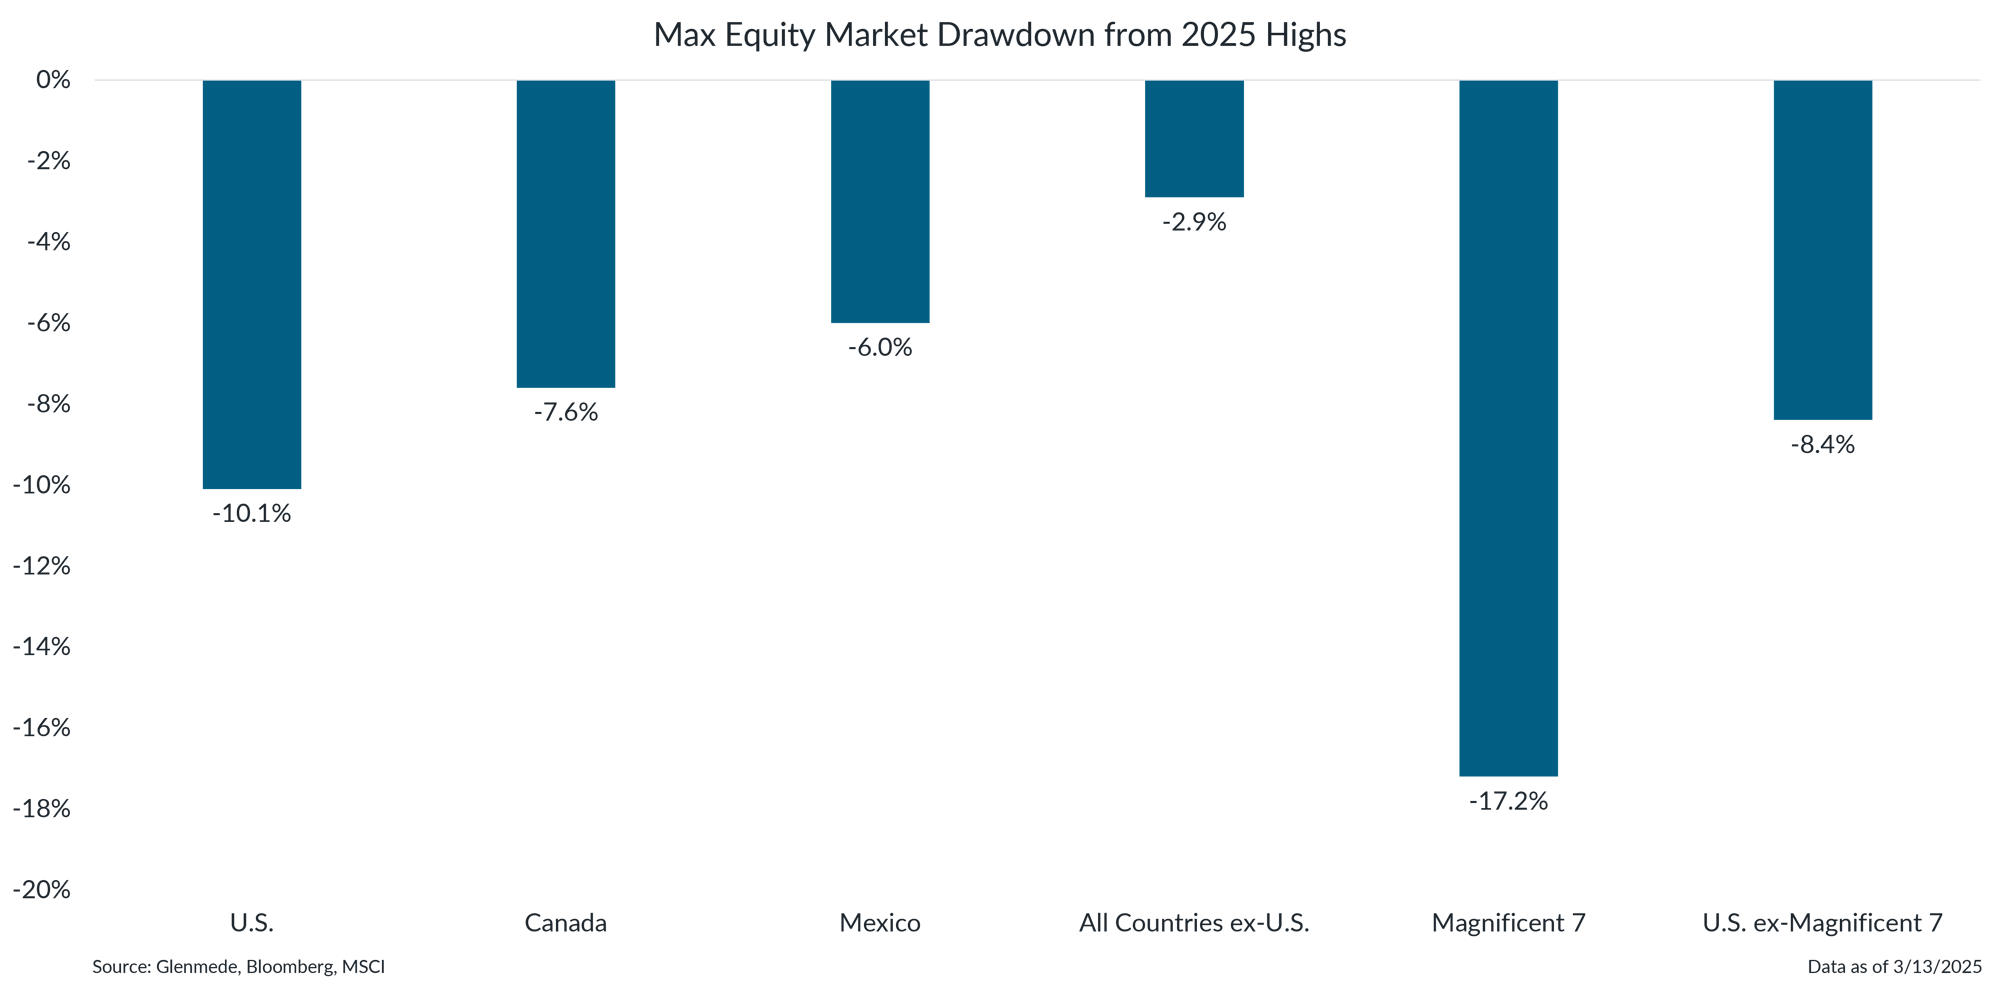
Data shown are the percentage drawdowns from 2025 highs for the S&P 500, MSCI Canada index, MSCI Mexico index, MSCI All Country World ex-U.S. index, Magnificent 7 (Apple, Alphabet, Amazon, Meta, Microsoft, Nvidia, Tesla) and the S&P 500 index excluding the Magnificent 7. References to individual stocks should not be construed as a recommendation to buy, hold or sell. Past performance may not be indicative of future results. One cannot invest directly in an index.
- Country-level market performance has been highlighted by drawdowns in regions directly affected by U.S. trade actions so far, with the Magnificent 7 stocks leading the decline.
- This year’s market performance has been case-in-point for the benefit of investment processes that avoid the pitfalls of market concentration and include allocations to foreign equities.
Declines in U.S. markets have reduced elevated valuations to more normal levels
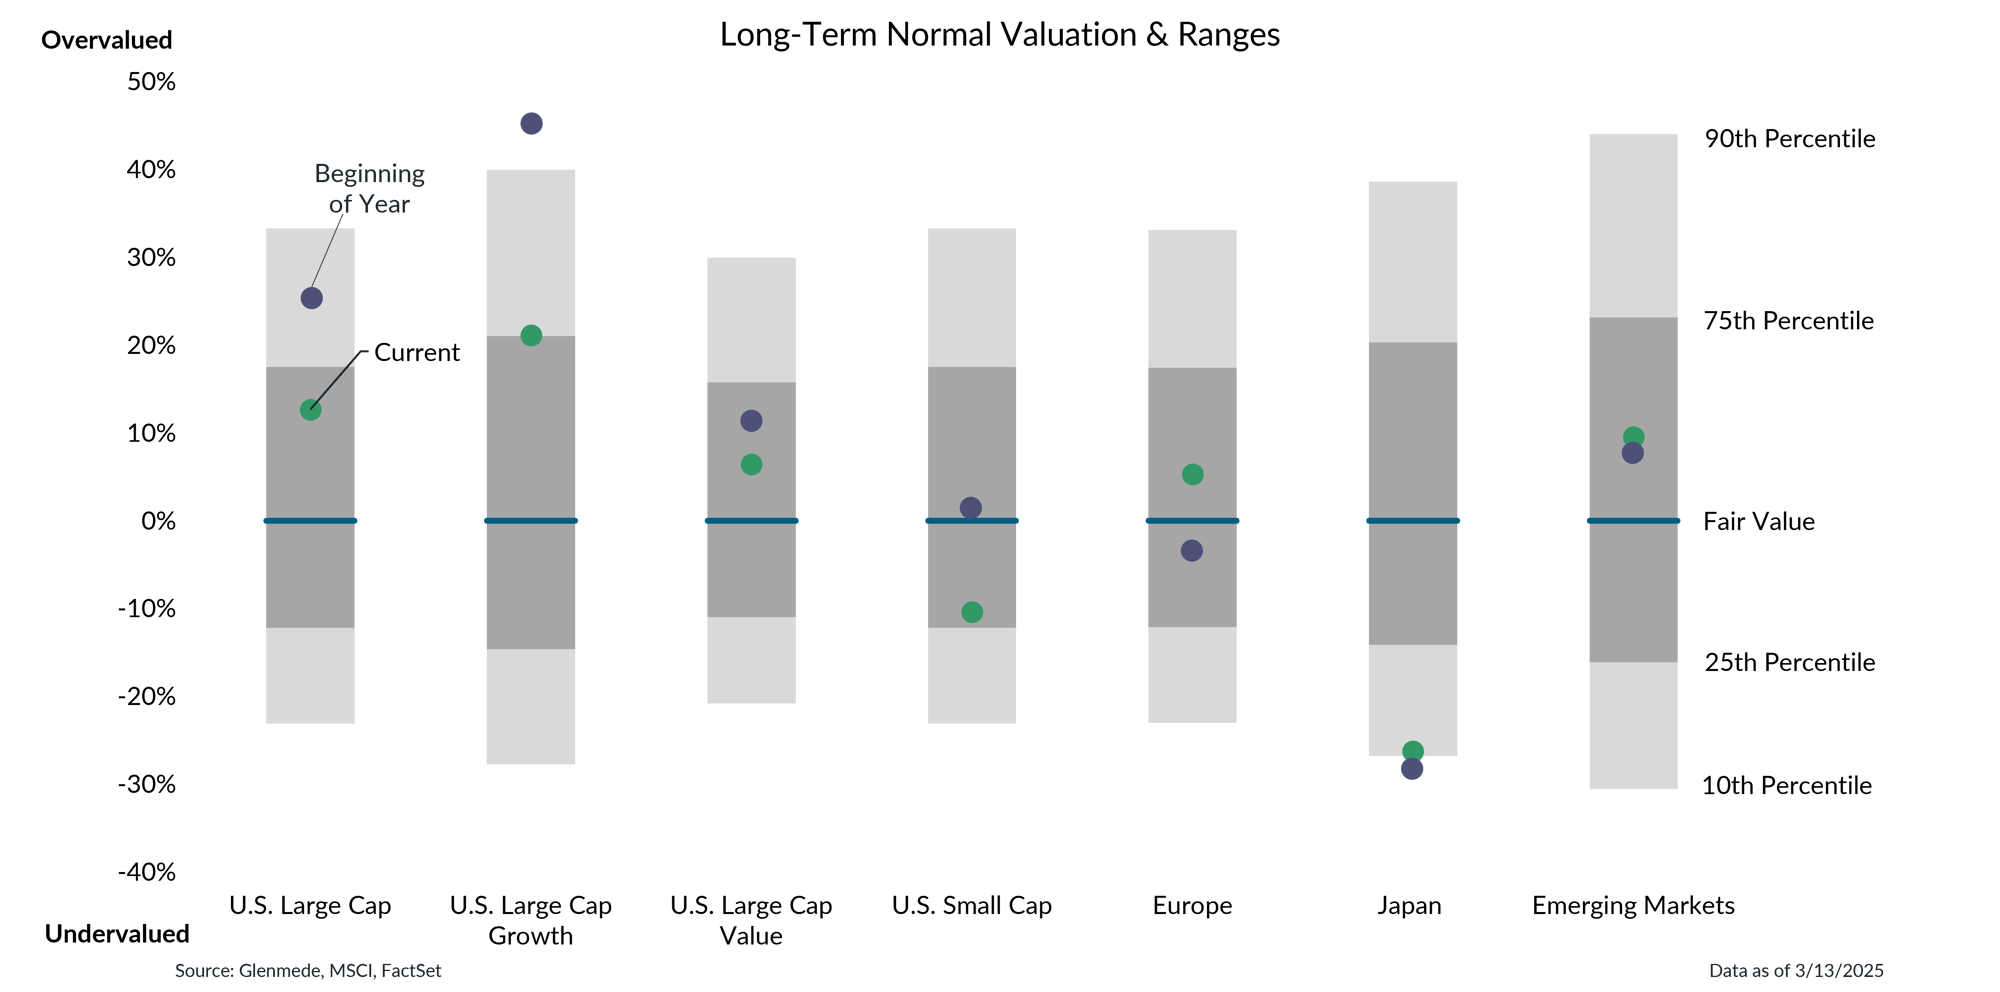
Data shown are Glenmede’s estimates of long-term fair value for U.S. Large Cap (MSCI USA), U.S. Large Cap Growth (MSCI USA Growth), U.S. Large Cap Value (MSCI USA Value), U.S. Small Cap (MSCI USA Small), Europe (MSCI Europe), Japan (MSCI Japan) and Emerging Markets (MSCI EM) based on normalized earnings, normalized cash flows, dividend yield and book value for each index. Green dots represent current valuation levels and purple dots represent valuation levels at the beginning of 2025. Glenmede’s estimates of fair value are arrived at in good faith, but longer-term targets for valuation may be uncertain. One cannot invest directly in an index.
- Large cap, large cap growth and small cap have seen a significant improvement in valuations as markets have declined, presumably in connection with the perceived impact of tariffs.
- International markets have seen valuations rise modestly as investors have favored areas less impacted by the tariff policies announced so far.
Uncertainty over trade policy and falling sentiment appear the primary drivers of the decline
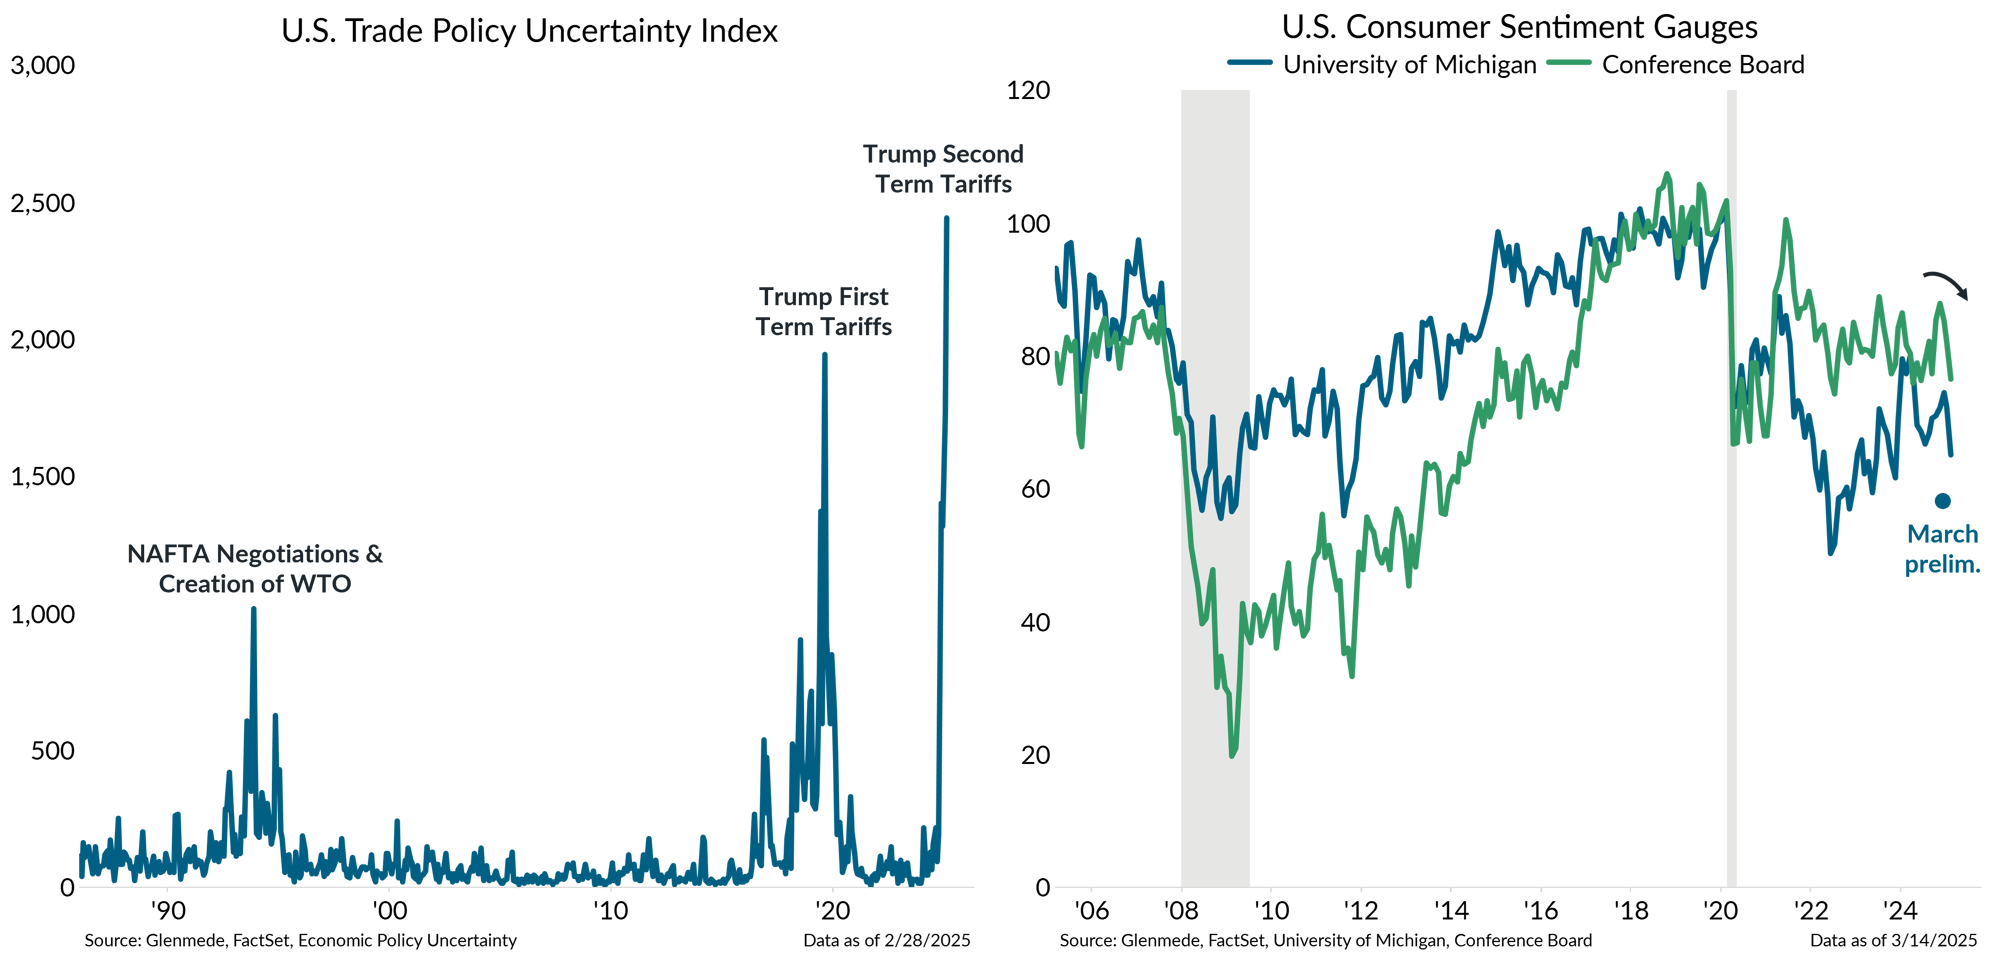
Shown in the left panel is the U.S. Trade Policy Uncertainty Index, which reflects the frequency of articles in American newspapers that discuss policy-related economic uncertainty and contain one or more references to trade policy. NAFTA stands for the North American Free Trade Agreement. WTO stands for the World Trade Organization. Shown in the right panel are the University of Michigan’s Consumer Sentiment Index in blue and the Conference Board’s Consumer Confidence Index in green, both indexed to 100 at the end of 2019. The blue dot represents the preliminary reading for March in the University of Michigan survey.
- Trade policy uncertainty has been the key focus for markets amid the recent downturn, with frequent news articles reflecting trade uncertainty reaching multi-decade highs.
- Consumer sentiment, which similarly saw an increase in optimism, has also declined, primarily due to uncertainty surrounding tariffs and concerns over inflation.
Growth expectations have been lowered for the first half of this year, but recession is not the base case
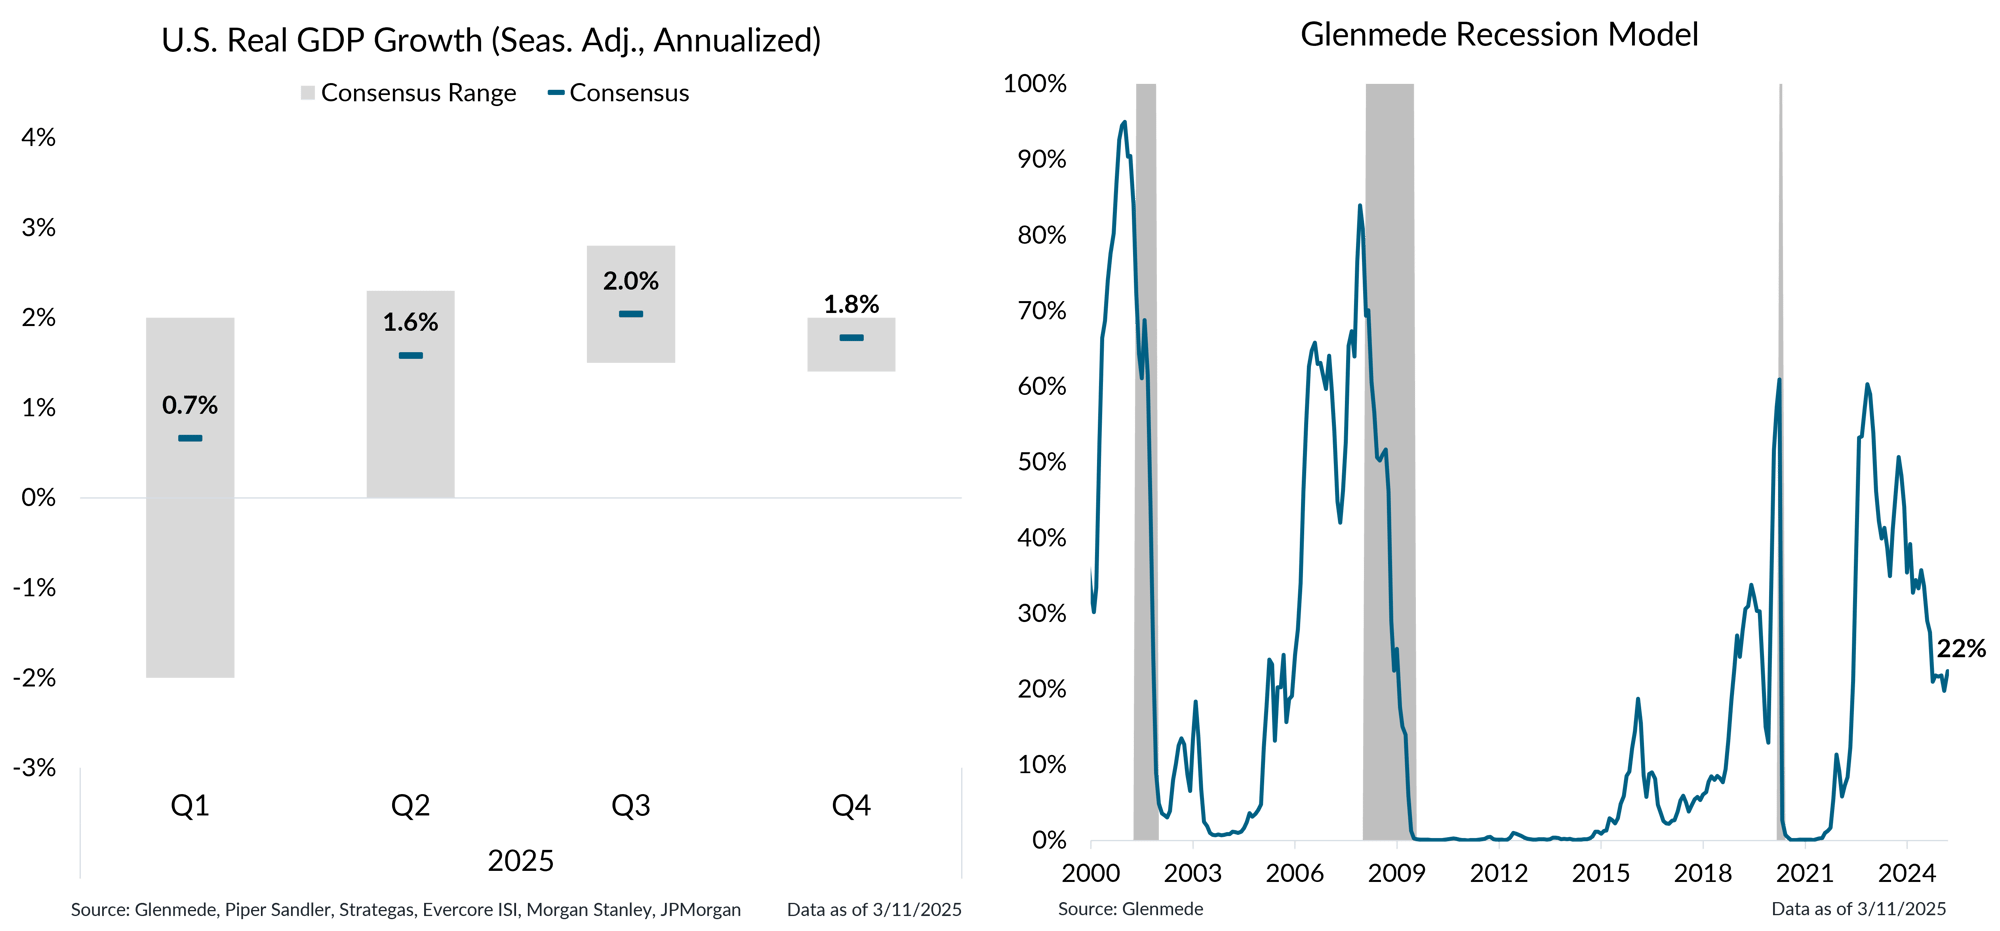
Shown in the left panel in gray is a range of estimates for quarterly U.S. real gross domestic product (GDP) growth on a seasonally adjusted annualized basis on a top-down basis from economists. The blue dashes represent the average of estimates. Actual results may differ materially from expectations. Shown in the right panel is Glenmede’s Recession Model, a tool developed by Glenmede to estimate the probability of a recession in the U.S. occurring within the next 12 months. The model is a balanced mix of (1) long-term excess indicators covering manufacturing, employment and debt balances and (2) near-term leading indicators covering monetary policy, credit markets, business sentiment and other economic trends. Shaded areas represent recession periods of the U.S. economy. Though created in good faith, there can be no guarantee that these indicators will be accurate. The model was established in 2015. The data shown for prior periods represents backtested results. Actual results may differ materially from expectations.
- Many economists have lowered their forecasts for the first half of 2025 due to tariff headwinds but expect those impacts to be short-lived with better prospects in the second half of the year.
- Glenmede’s Recession Model continues to see only a modest risk of a downturn as businesses and consumers remain in relatively good shape despite recent sentiment readings.
This material is intended to review matters of possible interest to Glenmede Trust Company clients and friends and is not intended as personalized investment advice. When provided to a client, advice is based on the client’s unique circumstances and may differ substantially from any general recommendations, suggestions or other considerations included in this material. Any opinions, recommendations, expectations or projections herein are based on information available at the time of publication and may change thereafter. Information obtained from third-party sources is assumed to be reliable but may not be independently verified, and the accuracy thereof is not guaranteed. Outcomes (including performance) may differ materially from any expectations and projections noted herein due to various risks and uncertainties. Any reference to risk management or risk control does not imply that risk can be eliminated. All investments have risk. Clients are encouraged to discuss any matter discussed herein with their Glenmede representative.

Feature one
Use text and images to tell your company’s story. Explain what makes your product or service extraordinary.

Feature two
Use text and images to tell your company’s story. Explain what makes your product or service extraordinary.

Feature three
Use text and images to tell your company’s story. Explain what makes your product or service extraordinary.

