Investment Strategy Brief
Bad News Is Bad News or Just a Market Correction?
August 2, 2024

Executive Summary
- Stock markets have experienced a 5%+ correction, which is not unusual, particularly following the 15% return in the first half of the year.
- The downside surprise in the July employment report highlights risks to the economy, but more likely reflects a normalizing labor market than one that is in decline.
- Labor market normalization and moderating inflation open the door for the Federal Reserve to commence a rate-cutting cycle to bring rates closer to neutral.
- The U.S. economy is in the late cycle with a balance of risks to the upside and downside, warranting active rebalancing of portfolios back to long-term policies.
Market corrections are common, often occurring once a year amid shifting expectations and risks
.png?width=2000&height=1032&name=IS%20Brief%20Chart%201%202024-08-05%20(2).png)
The S&P 500 is a market capitalization weighted index of large cap stocks. Returns are based on the price index only. Max intra-year drawdown refers to the largest intra-year drop. Past performance may not be indicative of future results. One cannot invest directly in an index.
-
After a 15%+ gain in the first half of 2024, markets have experienced a 5%+ decline amid some slowing economic data and mixed corporate earnings reports.
-
Market corrections are quite common, often occurring once a year amid shifting expectations and heightened perceived risks.
The July employment more likely reflects a normalizing labor market than one that is in decline

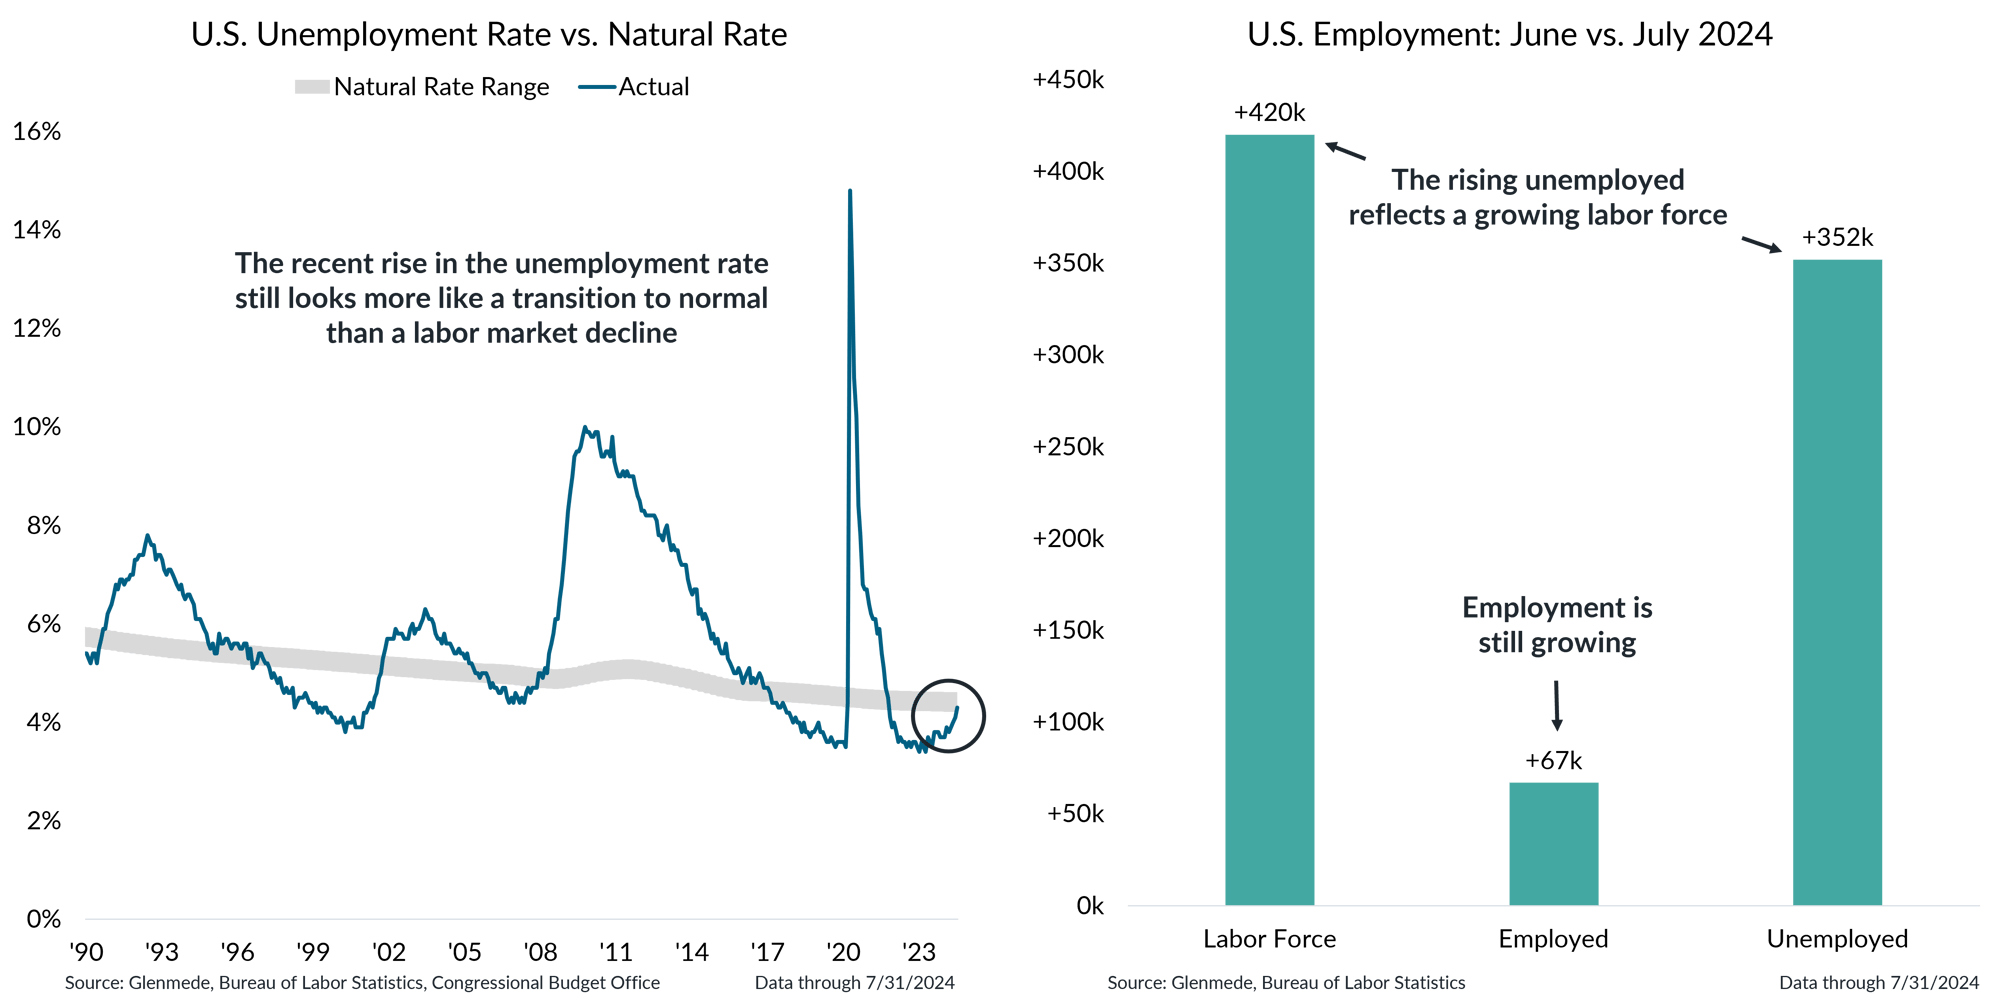
Shown in the left panel is the U.S. unemployment rate for persons aged 16 years and over on a seasonally-adjusted basis in blue and a range estimate of the natural rate of unemployment in gray, which is the baseline level of joblessness that persists in a well-functioning economy due to frictional and structural factors. Shown in the right panel are the month-over-month changes in the civilian labor force, the number of employed persons and the number of unemployed persons in the U.S.
-
Markets have proved sensitive to recent jobs data, which showed an increasing unemployment rate for the month of July.
-
The recent rise in the unemployment rate still looks more like a transition to normal than a labor market decline, especially given the sizable increase in the labor force.
The Fed is still likely to begin cutting rates in 2024, starting a long way from neutral

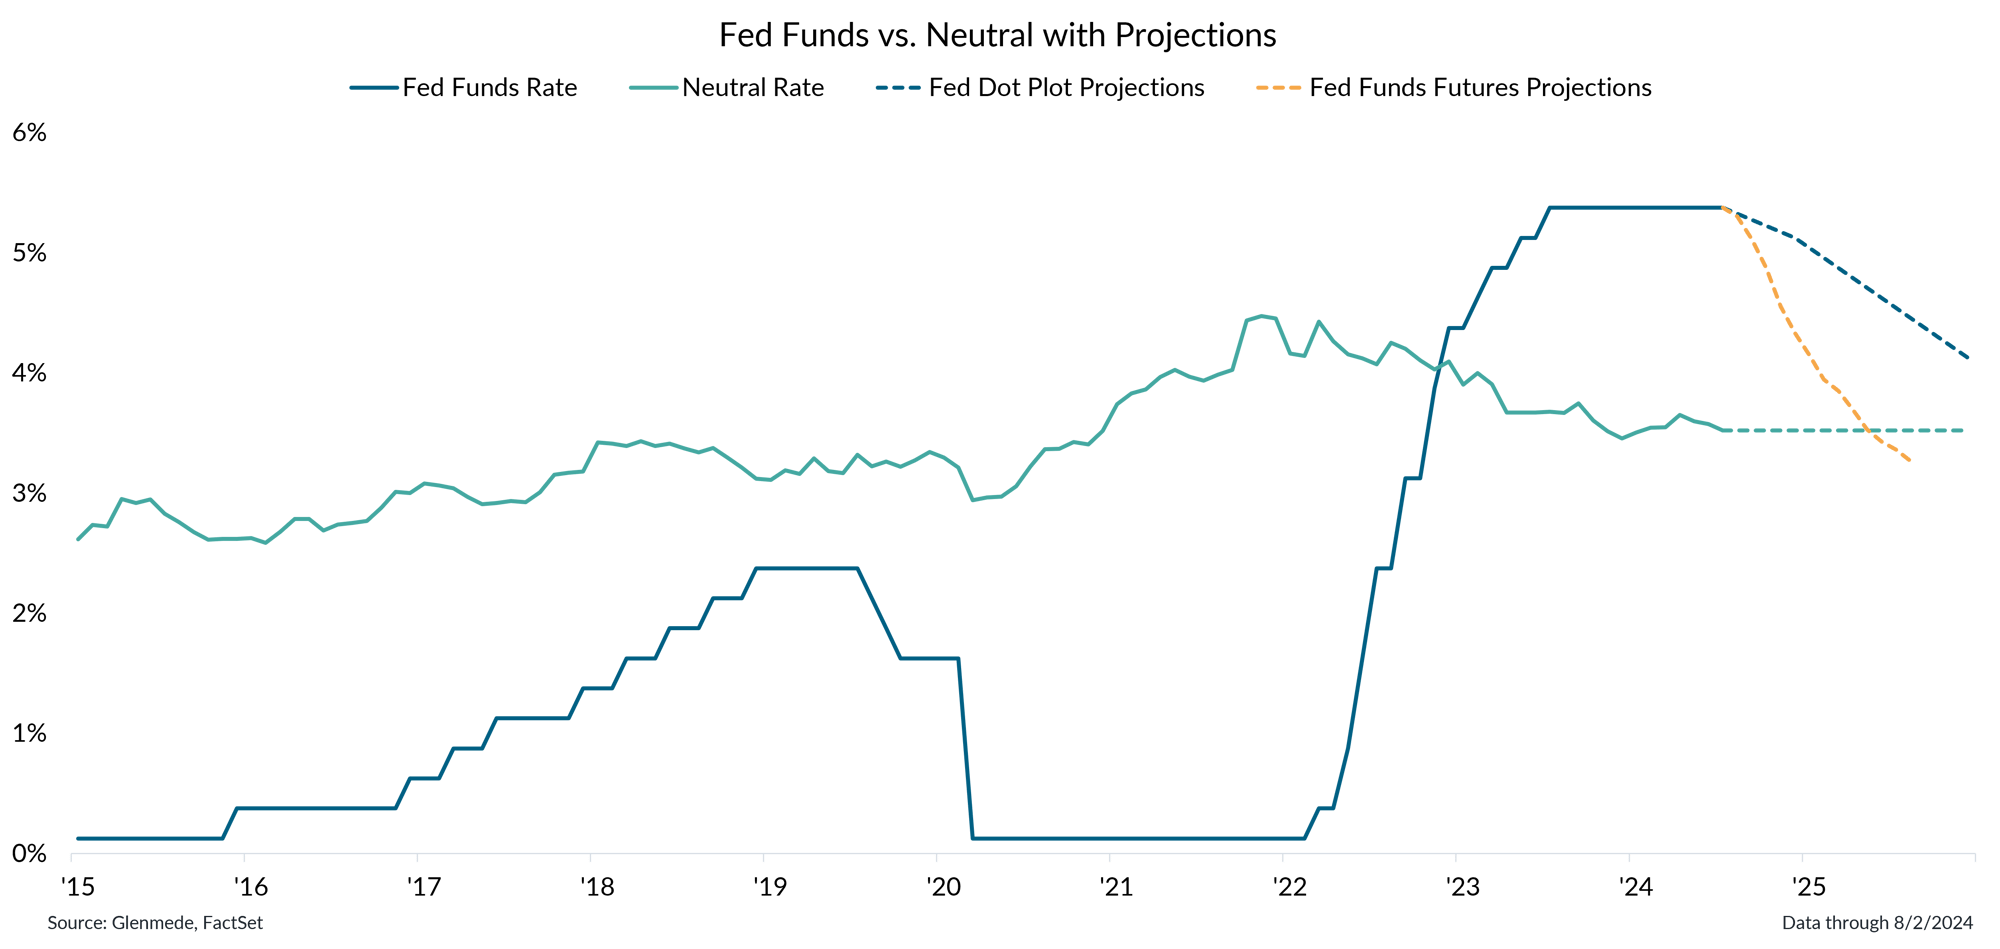
Data shown in green are Glenmede’s estimates of the neutral federal funds rate over time (i.e., the level of rates that is neither economically stimulative nor restrictive) based on expectations for real interest rates via the Holston-Laubach-Williams model and Glenmede’s 10yr inflation expectations. Fed Funds Rate in blue is the target rate midpoint. The dashed blue line represents projections based on the median response in the Federal Open Market Committee’s latest dot plot survey. The dashed yellow line represents projections based on fed funds futures. Actual results may differ materially from projections.
-
The Federal Reserve is nearing its first post-pandemic rate cut as the labor market has normalized and inflation has declined into its target range.
-
Financial market participants are expecting the Fed to embark on a rate cut campaign that would bring rates down close to neutral by late 2025.
The U.S. economy remains in late cycle, characterized by more muted returns and greater recession risk

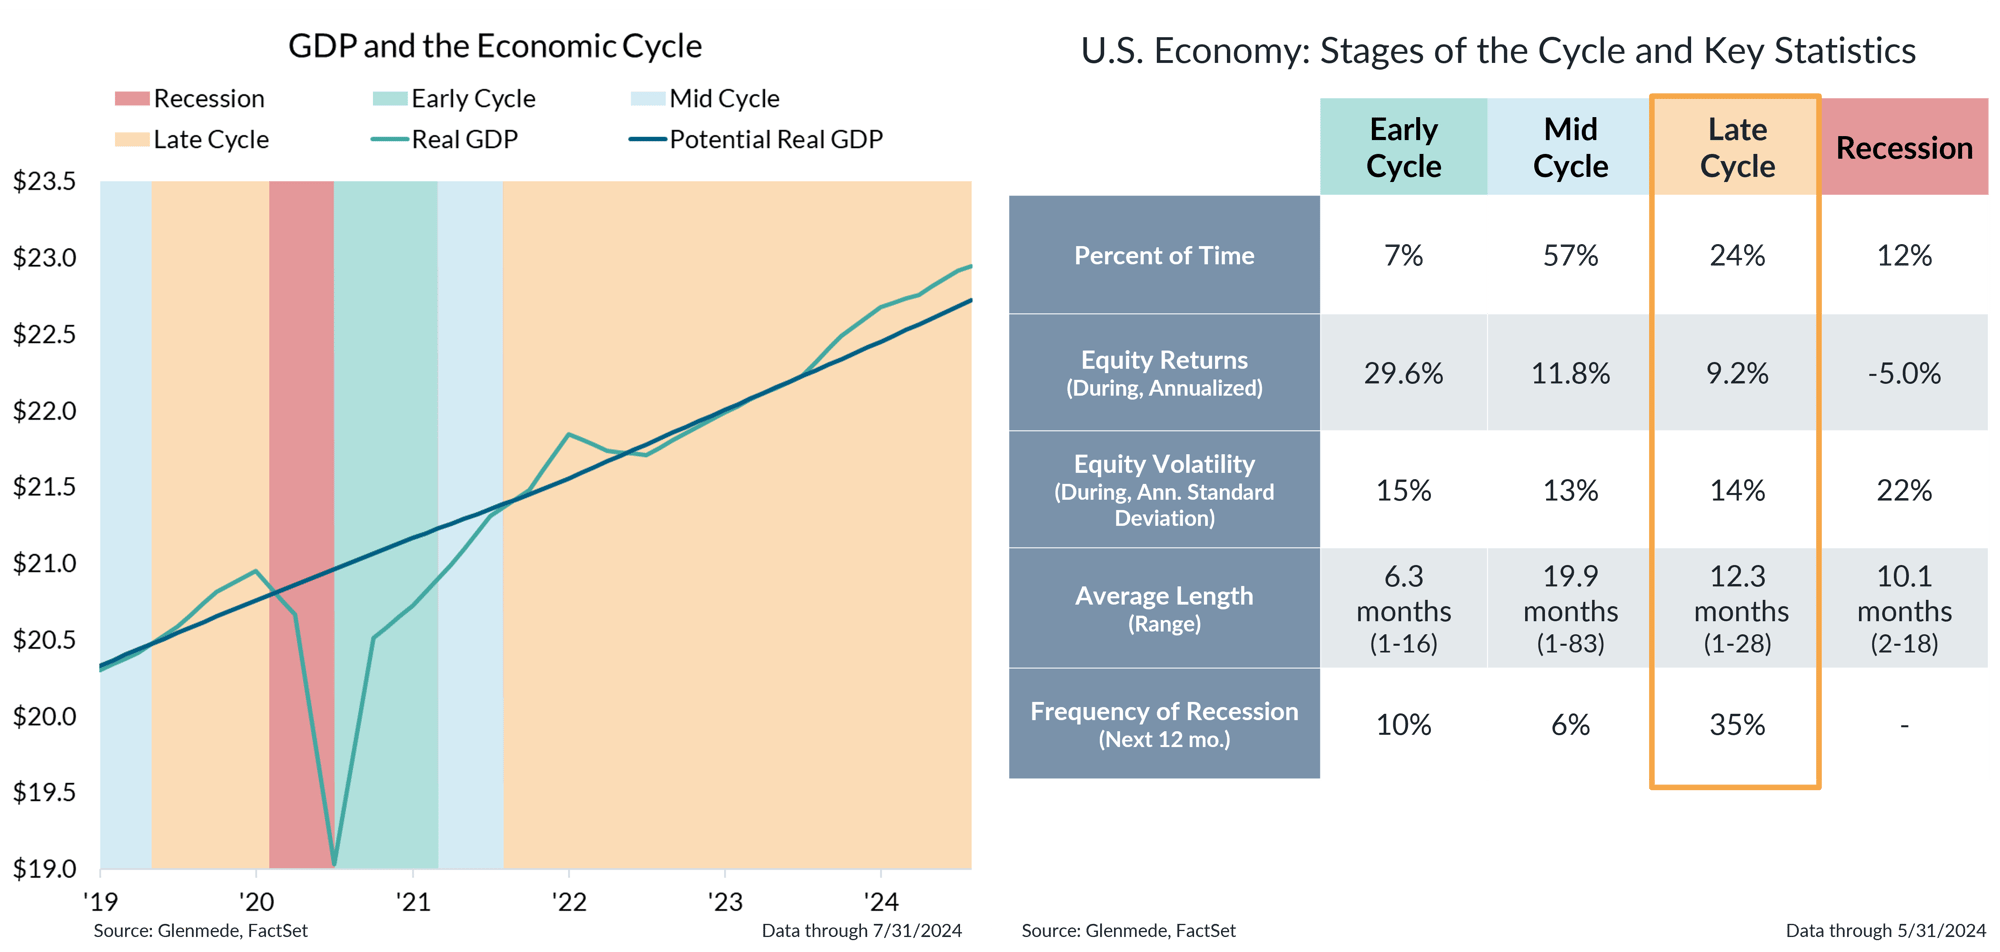
Data shown in the left panel is GDP, potential GDP and various stages of the economic cycle. Red, green, blue and yellow shaded regions represent recessions, early cycle, mid cycle and late cycle economic expansion in the U.S., respectively. Recession refers to periods of economic downturn, Early Cycle refers to rebounds from recessions, Mid Cycle refers to ongoing growth up to the economy’s potential and Late Cycle refers to periods where the economy is operating at or above potential. The table shown in the right panel shows key statistics around the stages of the business cycle in the U.S since 1962, based on a Glenmede analysis of typical economic behavior from a handful of leading and excess indicators. All references to equity returns refer to performance of the S&P 500 Index. The S&P 500 is a market capitalization weighted index of large cap stocks in the U.S. Past performance may not be indicative of future results. One cannot invest directly in an index.
- We believe the U.S. economy remains in late cycle, which is typically an environment in which investors should actively monitor risks that could tip the U.S. toward recession.
- On average, late cycle expansions are typically categorized by mid-single-digit equity returns, suggesting investors should temper their expectations going forward.
This material is intended to review matters of possible interest to Glenmede Trust Company clients and friends and is not intended as personalized investment advice. When provided to a client, advice is based on the client’s unique circumstances and may differ substantially from any general recommendations, suggestions or other considerations included in this material. Any opinions, recommendations, expectations or projections herein are based on information available at the time of publication and may change thereafter. Information obtained from third-party sources is assumed to be reliable but may not be independently verified, and the accuracy thereof is not guaranteed. Outcomes (including performance) may differ materially from any expectations and projections noted herein due to various risks and uncertainties. Any reference to risk management or risk control does not imply that risk can be eliminated. All investments have risk. Clients are encouraged to discuss any matter discussed herein with their Glenmede representative.

Feature one
Use text and images to tell your company’s story. Explain what makes your product or service extraordinary.

Feature two
Use text and images to tell your company’s story. Explain what makes your product or service extraordinary.

Feature three
Use text and images to tell your company’s story. Explain what makes your product or service extraordinary.

