Investment Strategy Brief
(Corporate) Zombies Among Us
October 27, 2024

Executive Summary
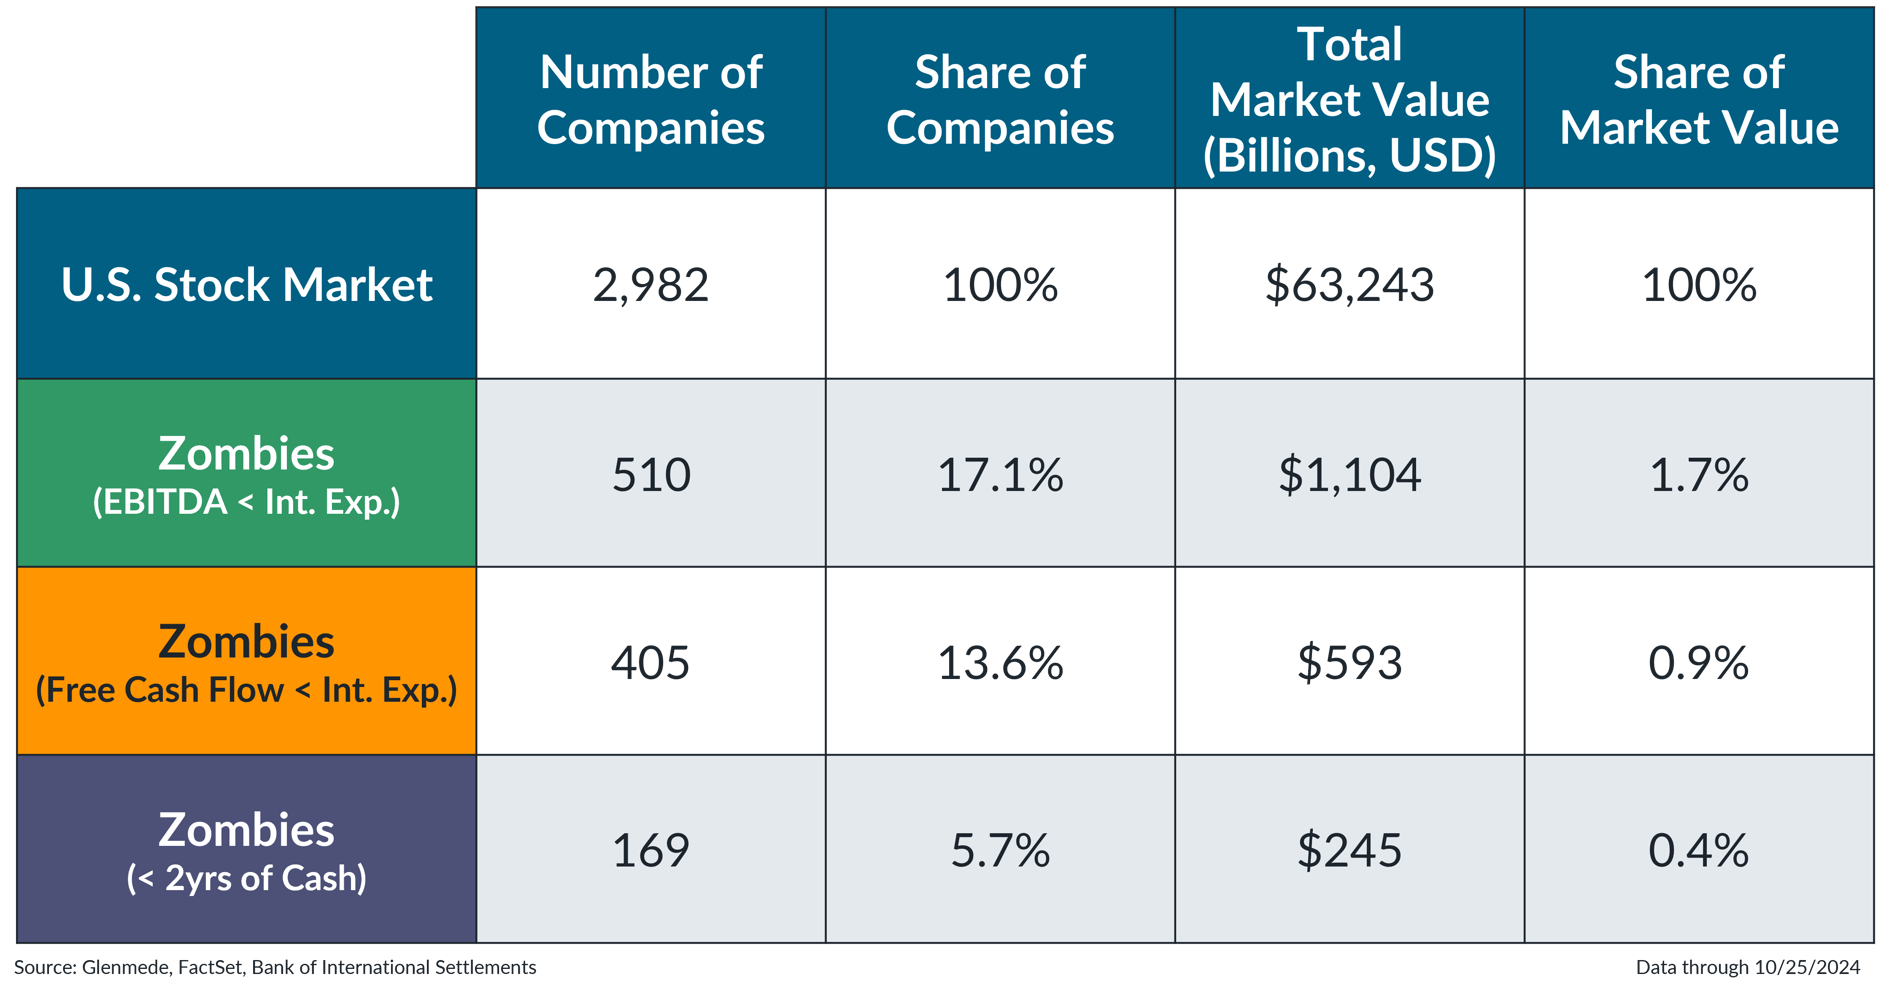
- The share of unprofitable firms (i.e., zombies) has remained elevated, representing about 17% of public companies but only ~2% of U.S. market capitalization.
- Companies at risk of cash shortfalls over the next two years are an even smaller share and as corporate borrowing costs decline, pressure on zombie companies may begin to ease on the margin.
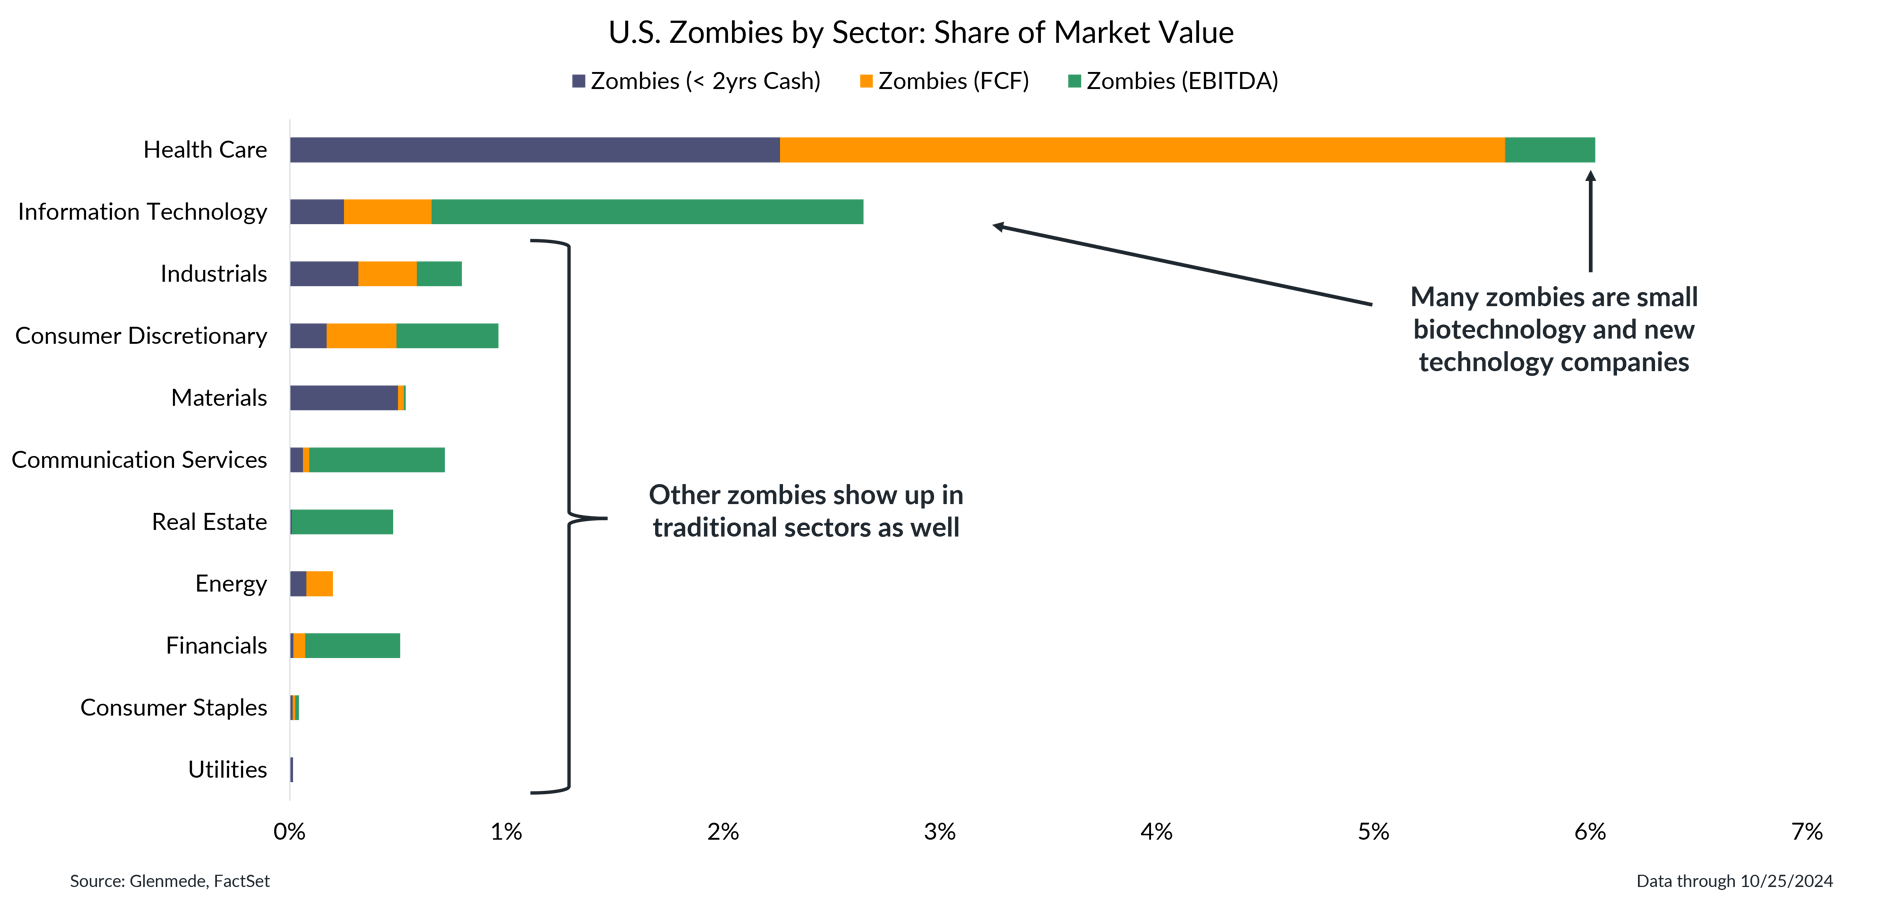
- The majority of zombie companies sit in the healthcare sector, dominated by smaller biotechnology firms.
- A quality orientation in small cap equities can limit a portfolio’s exposure to zombie companies.
There are a large number of zombie companies, but they represent a small share of total market value

U.S. Stock Market is represented by the Russell 3000 Index, which is a market capitalization weighted index of large, mid and small cap companies in the U.S. Zombies (EBITDA < Interest Expense) represent the subset of companies in the Russell 3000 whose earnings before interest, taxes, depreciation and amortization (i.e., EBITDA), have not covered their interest costs over the past three years. Zombies (Free Cash Flow < Interest Expense) adds an additional filter, including only those companies whose free cash flow have not covered their interest expense. Zombies (<2 yrs of Cash) adds another filter, including only those companies that have less than two years of cash on hand to cover projected expenses. Market value is represented by total market capitalization. Past performance may not be indicative of future results. One cannot invest directly in an index.
-
Zombie companies, defined as those that do not have enough earnings to cover the cost of interest on their debt, account for about 17% of public companies, but only ~2% of U.S. market capitalization.
- Perhaps most important, only a fraction of zombie companies are in an even more difficult position, without enough cash on their balance sheet to cover their expected expenses over the next 2 years.
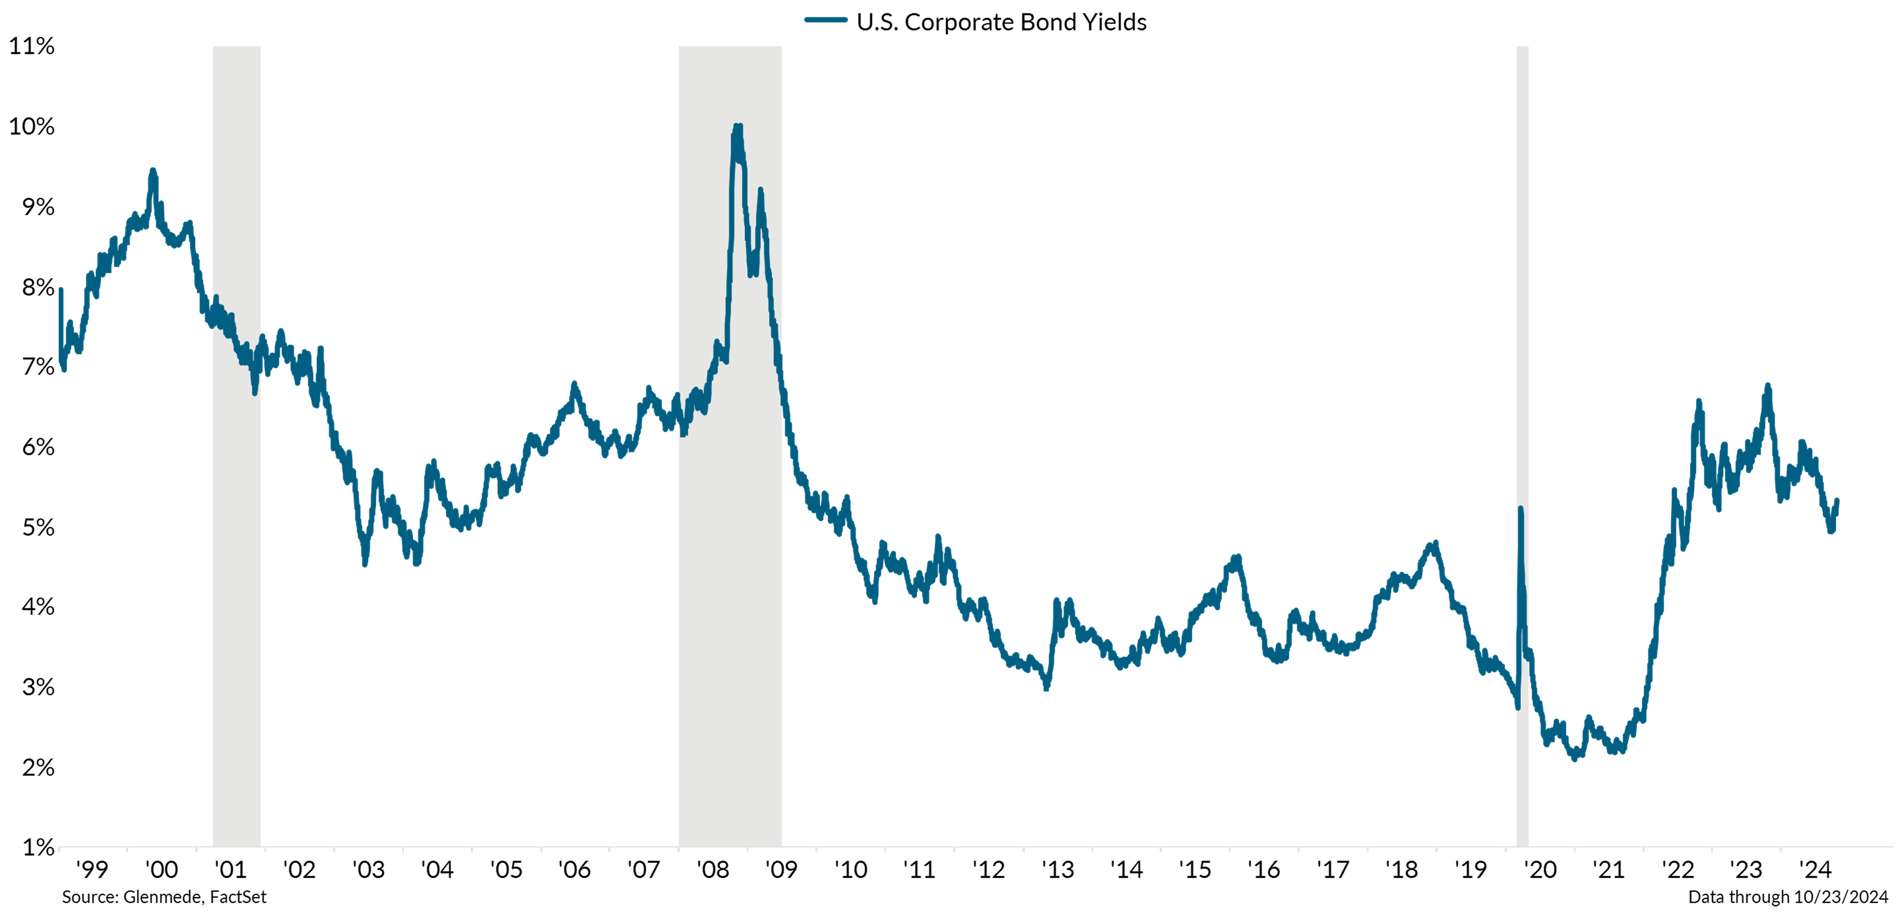
As corporate borrowing costs decline, pressure on companies may begin to ease on the margin

Data shown is the yield to worst on a market value weighted blend of the Bloomberg U.S. Aggregate Credit and Bloomberg U.S. Aggregate Credit High Yield indices, representing the publicly-traded investment grade and high yield corporate bond universes, respectively. Gray shaded regions represent periods of recession in the U.S. Past performance may not be indicative of future results. One cannot invest directly in an index.
- Some of the companies that fit these parameters can be newer firms, focused on establishing market presence before turning a profit, but many may be quite reliant on borrowing to remain afloat.
- The start of the Fed’s easing campaign could help reduce borrowing costs, offering relief to those facing near-term funding challenges.
Zombie companies are more prominent among smaller companies in particular sectors

Data shown is the share of market value in the Russell 3000 Index by sector that satisfy three conditions: 1) companies whose earnings before interest, taxes, depreciation and amortization (i.e., EBITDA) have not covered their interest costs over the past three years; 2) companies whose free cash flow have not covered their interest expenses; 3) companies that have less than two years of cash on hand to cover projected expenses. The Russell 3000 Index is a market capitalization weighted index of large, mid and small cap companies in the U.S. Past performance may not be indicative of future results. One cannot invest directly in an index.
-
A large number of zombie companies are in the biotech and tech sectors, where early-stage unprofitability is common but risky due to aggressive growth business models with delayed monetization.
- Zombies that sit in more traditional sectors often exhibit the more typical serial lack of profitability, limping from year-to-year with additional costly borrowing to remain in business.
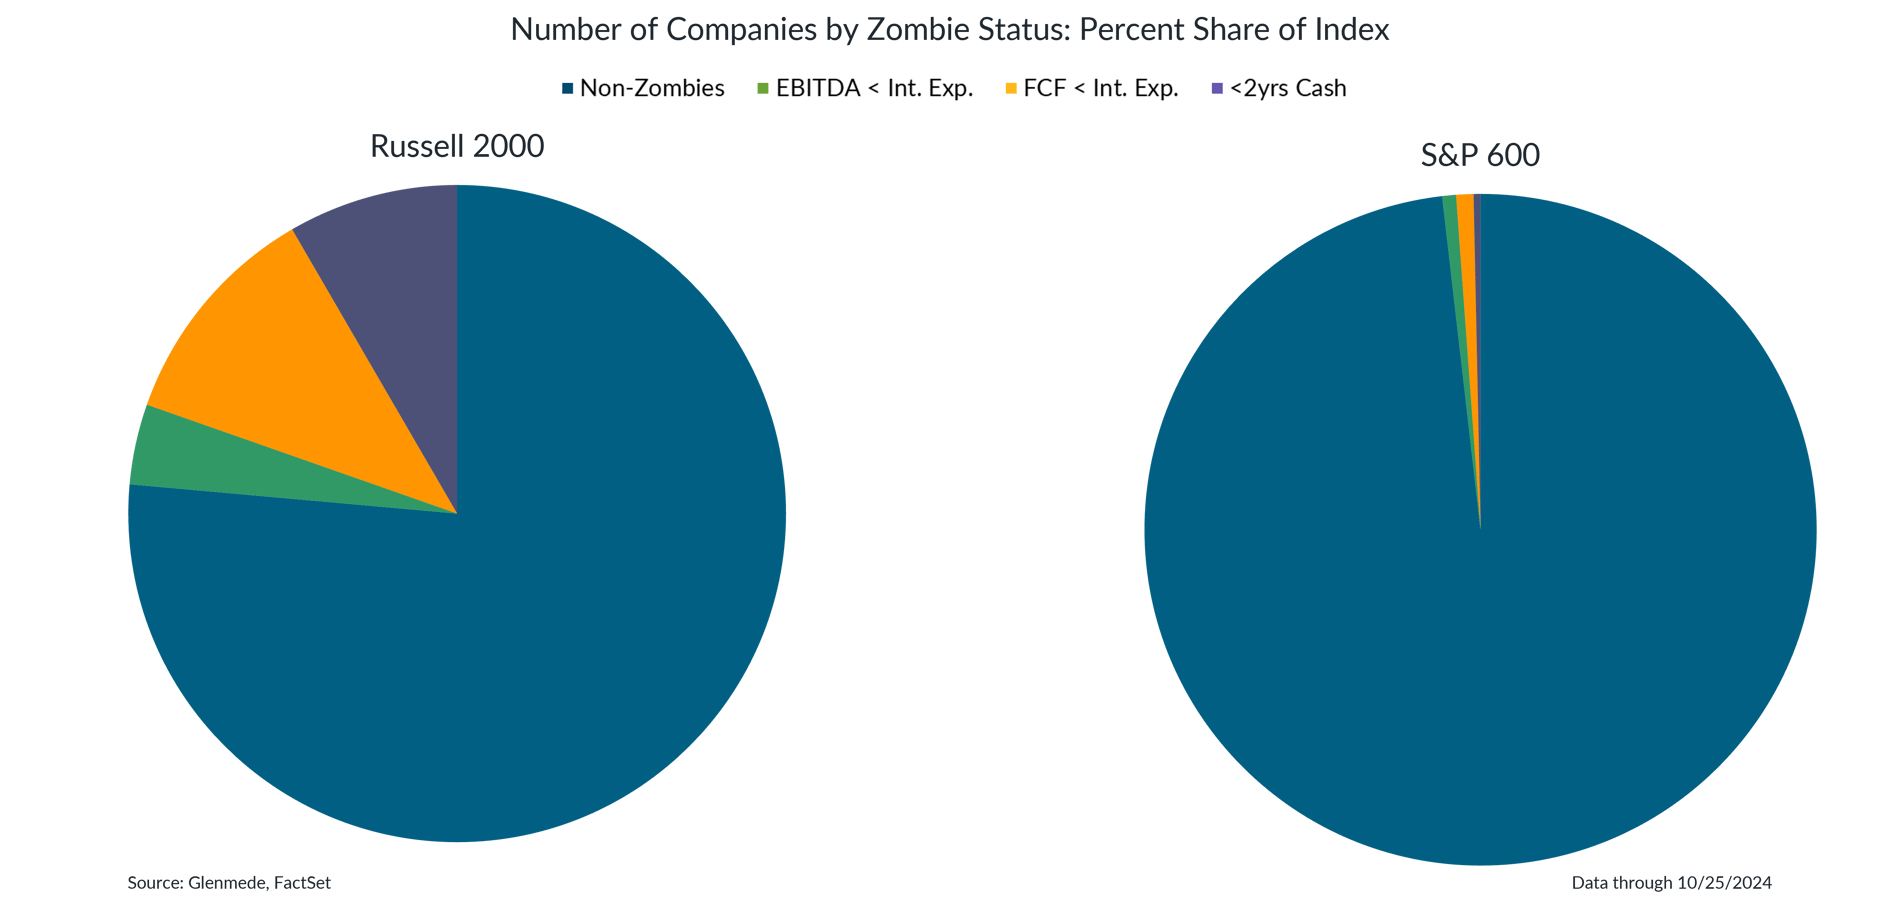
A quality-oriented approach to small cap equities largely avoids the zombie issue

Data shown are the percentage share of the Russell 2000 and S&P 600 indexes by zombie status. Zombies (EBITDA < Interest Expense) represent the subset of companies in each index whose earnings before interest, taxes, depreciation and amortization (i.e., EBITDA), have not covered their interest costs over the past three years. Zombies (Free Cash Flow < Interest Expense) adds an additional filter, including only those companies whose free cash flow have not covered their interest expense. Zombies (<2 yrs of Cash) adds another filter, including only those companies that have less than two years of cash on hand to cover projected expenses. The Russell 2000 Index is a market capitalization weighted index of U.S. small cap stocks. The S&P 600 is a market capitalization weighted index of U.S. small cap stocks, with profitability filters for inclusion in the index. One cannot invest directly in an index.
- Zombie companies tend to be concentrated in small caps, with about a quarter of Russell 2000 stocks classified as zombies, while the S&P 600's profitability screens dramatically reduce the number of zombies.
- For those seeking small-cap exposure, a quality-oriented approach can help avoid unprofitable zombie companies.
This material is intended to review matters of possible interest to Glenmede Trust Company clients and friends and is not intended as personalized investment advice. When provided to a client, advice is based on the client’s unique circumstances and may differ substantially from any general recommendations, suggestions or other considerations included in this material. Any opinions, recommendations, expectations or projections herein are based on information available at the time of publication and may change thereafter. Information obtained from third-party sources is assumed to be reliable but may not be independently verified, and the accuracy thereof is not guaranteed. Outcomes (including performance) may differ materially from any expectations and projections noted herein due to various risks and uncertainties. Any reference to risk management or risk control does not imply that risk can be eliminated. All investments have risk. Clients are encouraged to discuss any matter discussed herein with their Glenmede representative.

Feature one
Use text and images to tell your company’s story. Explain what makes your product or service extraordinary.

Feature two
Use text and images to tell your company’s story. Explain what makes your product or service extraordinary.

Feature three
Use text and images to tell your company’s story. Explain what makes your product or service extraordinary.

