Investment Strategy Brief
Executive Orders:
The First 100 Days Week
January 26, 2025

Executive Summary
- The President signed a record number of executive orders in his first week in office, covering a long list of intended policy shifts.
- Policies of note with economic relevance cover overall regulations, immigration, energy and global trade.
- Uncertainty surrounds the execution and ultimate impact of energy and immigration policies.
- New executive orders provide a mix of potentially offsetting economic headwinds and tailwinds but introduce a great degree of uncertainty.
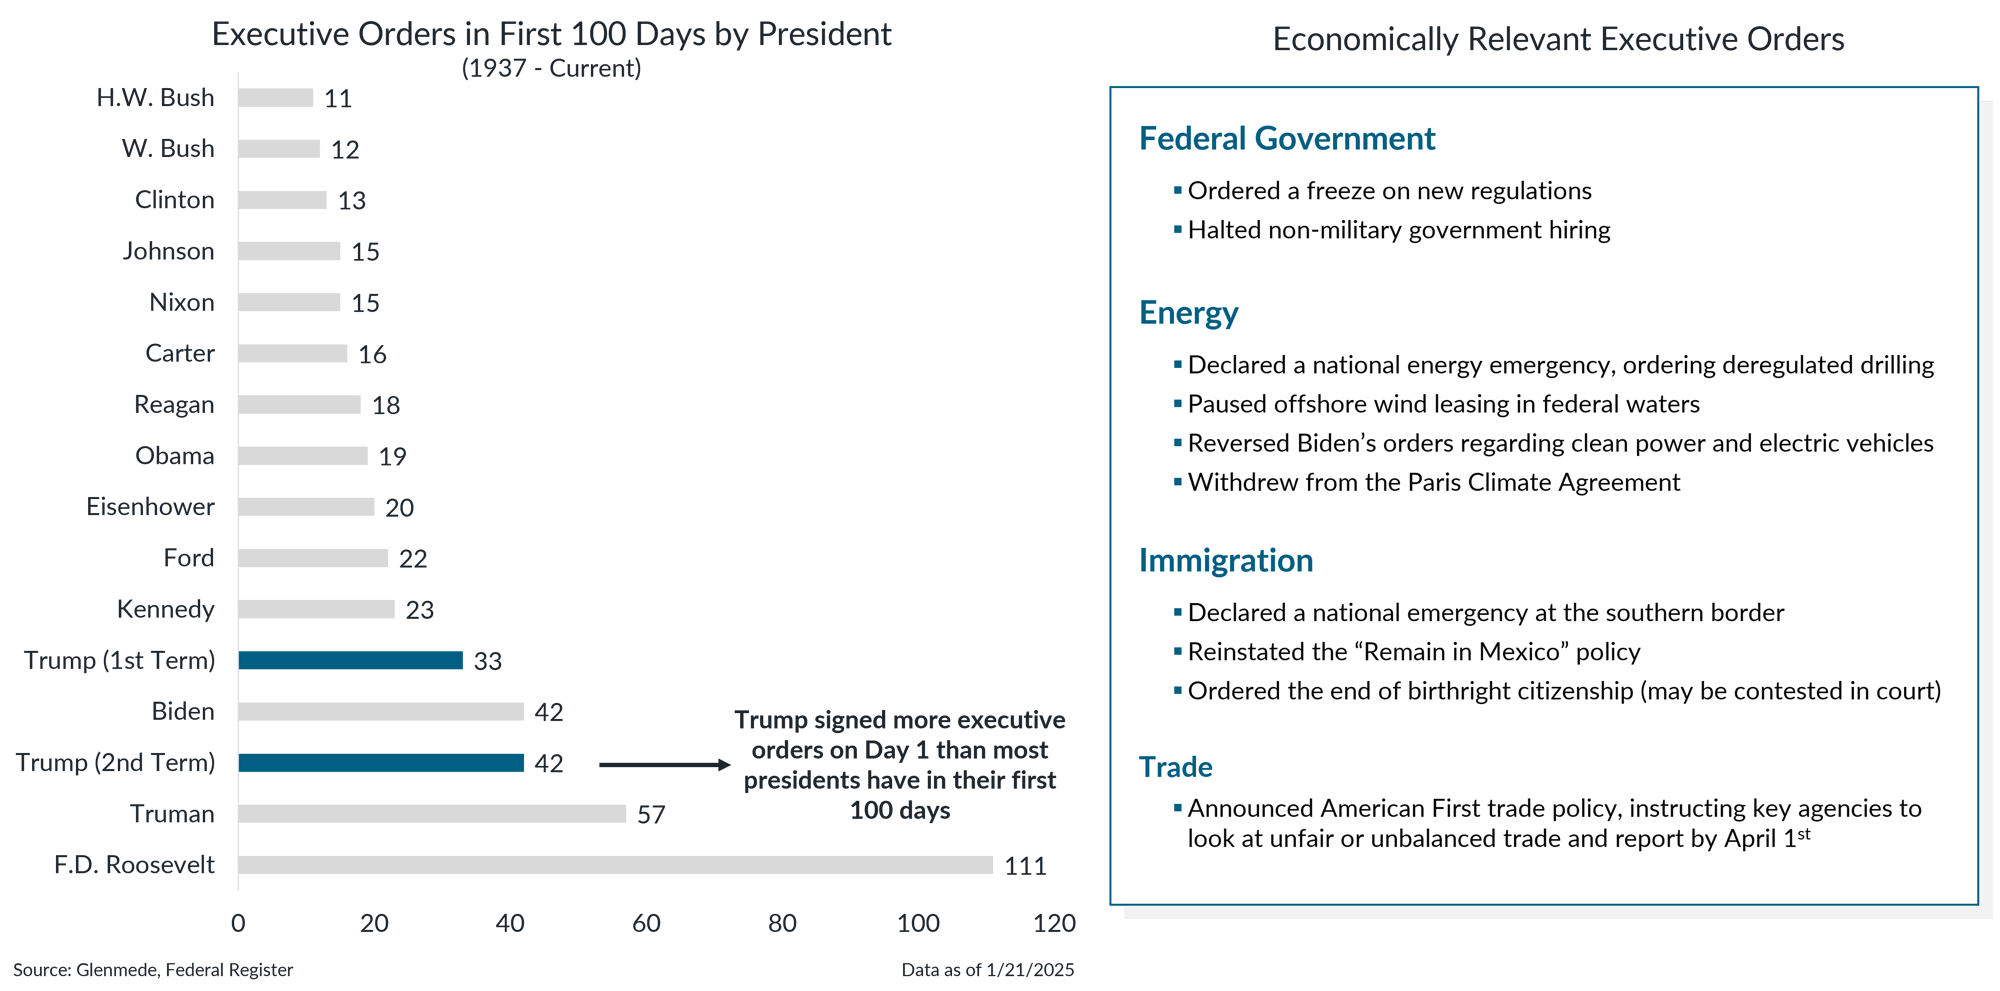
The President signed a record number of executive orders on Day 1, covering a broad range of policy areas

Data shown in the left panel are the number of executive orders issued by each president within the first 100 days of their presidency. Due to his non-consecutive terms, Trump is listed twice. Shown in the right panel is a summary highlighting some key economically relevant executive orders from the second Trump administration and is not meant to be an exhaustive list of all orders.
- Trump kicked off his second term by signing more executive orders on Day 1 than most presidents have in their first 100 days in office.
- The executive orders included a range of economically relevant policies, addressing critical areas such as regulation, immigration, energy and trade.
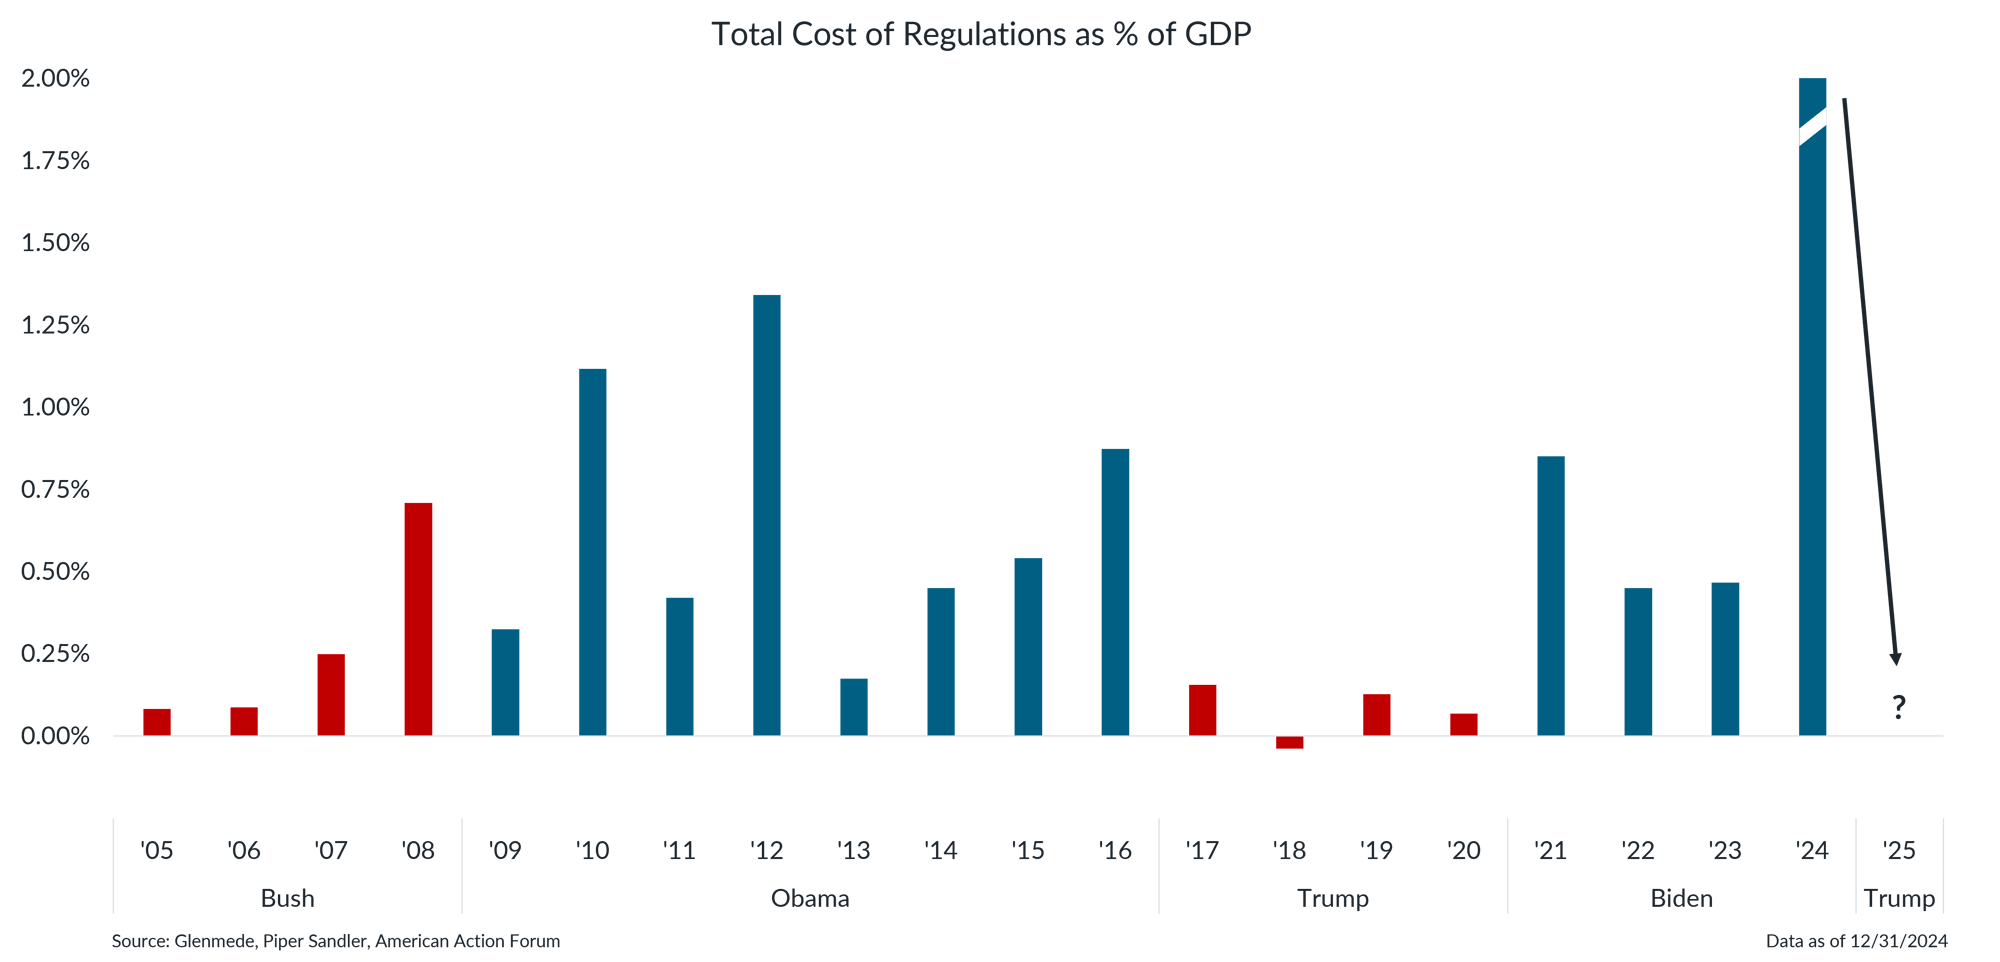
The administration has frozen new regulations, returning to a more business friendly regulatory approach

Data shown represent the estimated cost of new regulations as a % of GDP by year and grouped by presidential administration. The data point for ’24 is 4.8%, but the bar uses an axis break for visual purposes. American Action Forum is an independent, non-profit organization and is not formally affiliated with or controlled by any political group but may not be a completely unbiased source as it was established to promote “center-right” economic and fiscal policy. The use of its data should in no way be construed as an endorsement of the group’s political leaning, policy preferences or accuracy of estimates.
- When regulations are implemented, the high costs associated with compliance can reduce business efficiency, increase prices and potentially slow economic growth.
- The new administration has already ordered a freeze on new regulations, which may be a notable tailwind for economic growth and corporate profits.
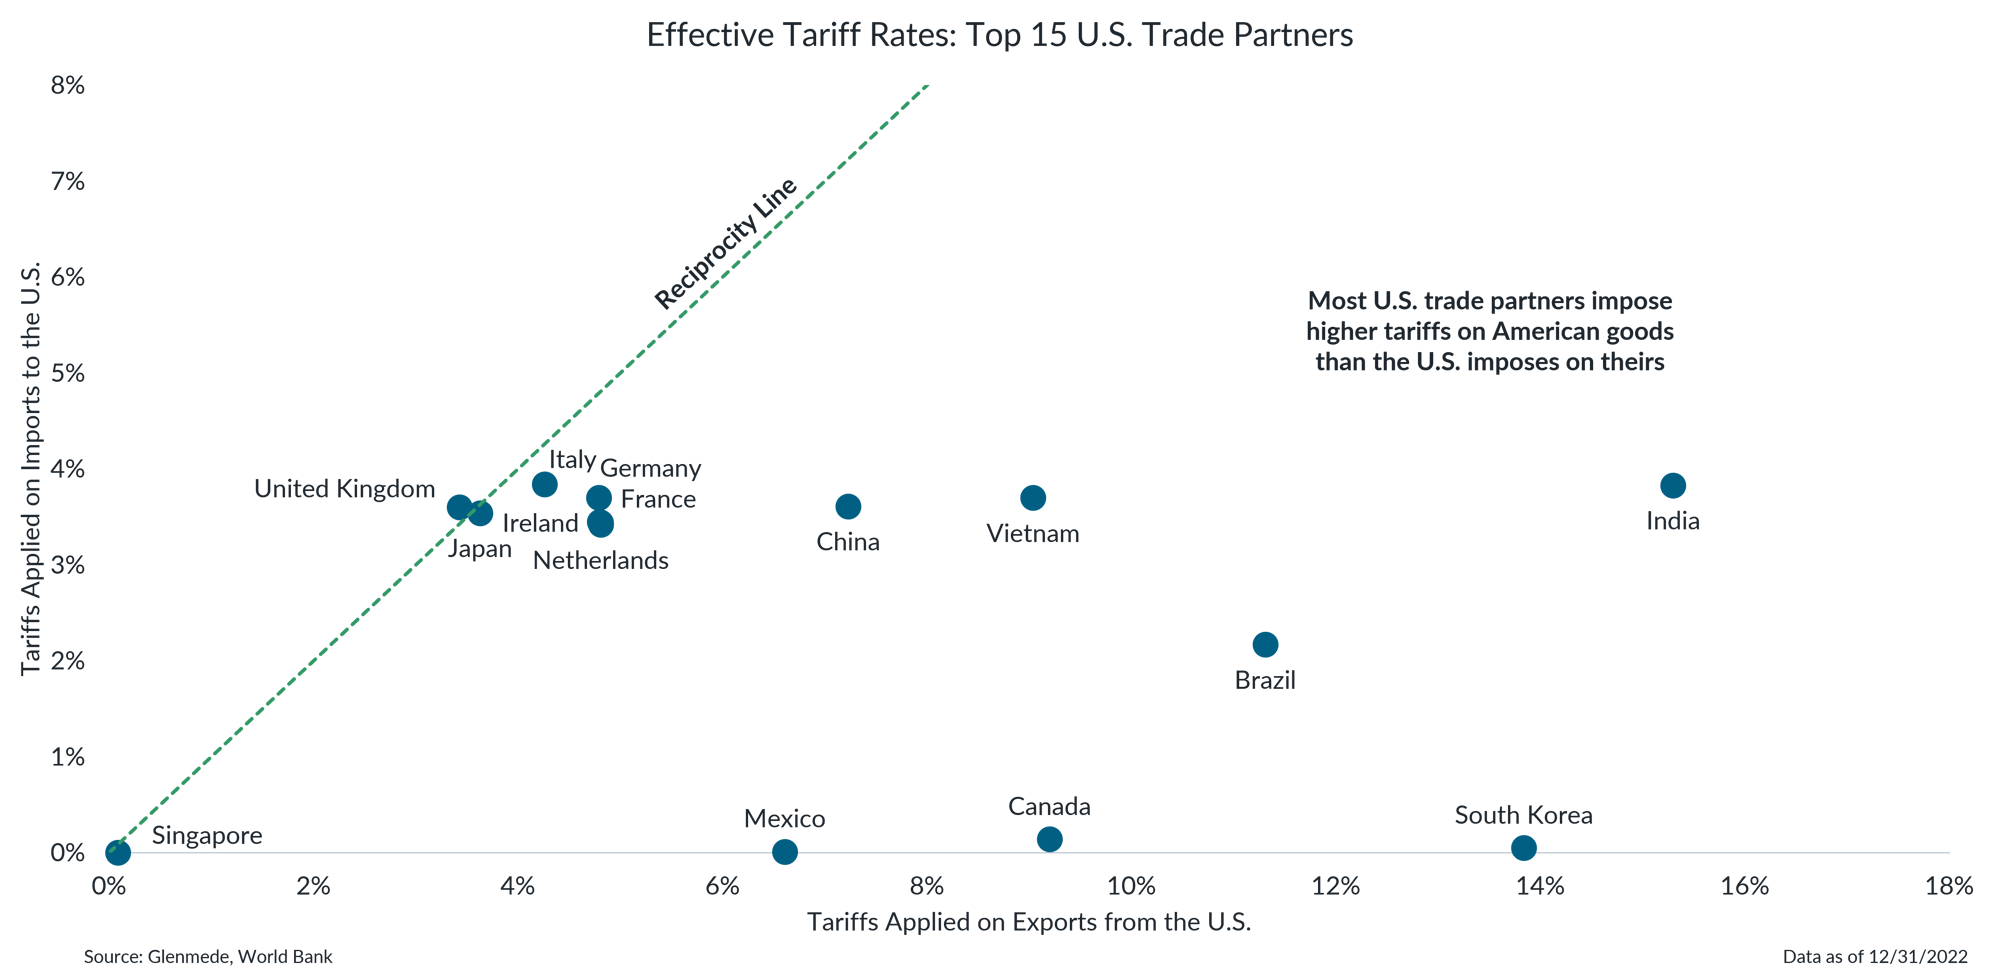
Apparent imbalances in effective tariff rates provide a justification for higher tariffs on U.S. trade partners

Data shown are effective tariff rates between the U.S. and the top 15 countries by amounts of goods and services exchanged in the trade relationship (i.e., sum of imports and exports). Graphed along the x-axis are effective tariff rates that apply to U.S. exports to each country and graphed along the y-axis are effective tax rates that the U.S. applies to imports from each country. The dashed green line is the reciprocity line, on which effective tariff rates on both axes are equal.
- Many of America’s top 15 trading partners impose higher tariffs on U.S. goods, yet the U.S. has not reciprocated with similar measures.
- The new administration is likely to use this as justification to introduce tariffs on countries like Canada, Mexico, China and other key global trading partners.
Supply side efforts may help alleviate energy-related inflation pressure

Data shown in the left panel are seasonally-adjusted monthly energy production figures in the U.S. for crude oil (blue), natural gas (green) and liquified natural gas (yellow), measured in quadrillions of British thermal units (BTUs). Data shown in the right panel are U.S. Producer Price Index (PPI) cumulative growth figures since 2019 on a final demand basis for all items, all items ex-energy, energy and transformers & power regulators.
- The administration plans to significantly increase energy production, with a key focus on ramping up oil output by 3 million barrels per day, as part of a broader strategy to enhance energy security.
- More supply may help ease energy prices, as components in electricity generation and distribution have been some of the biggest drivers of producer prices since 2019.
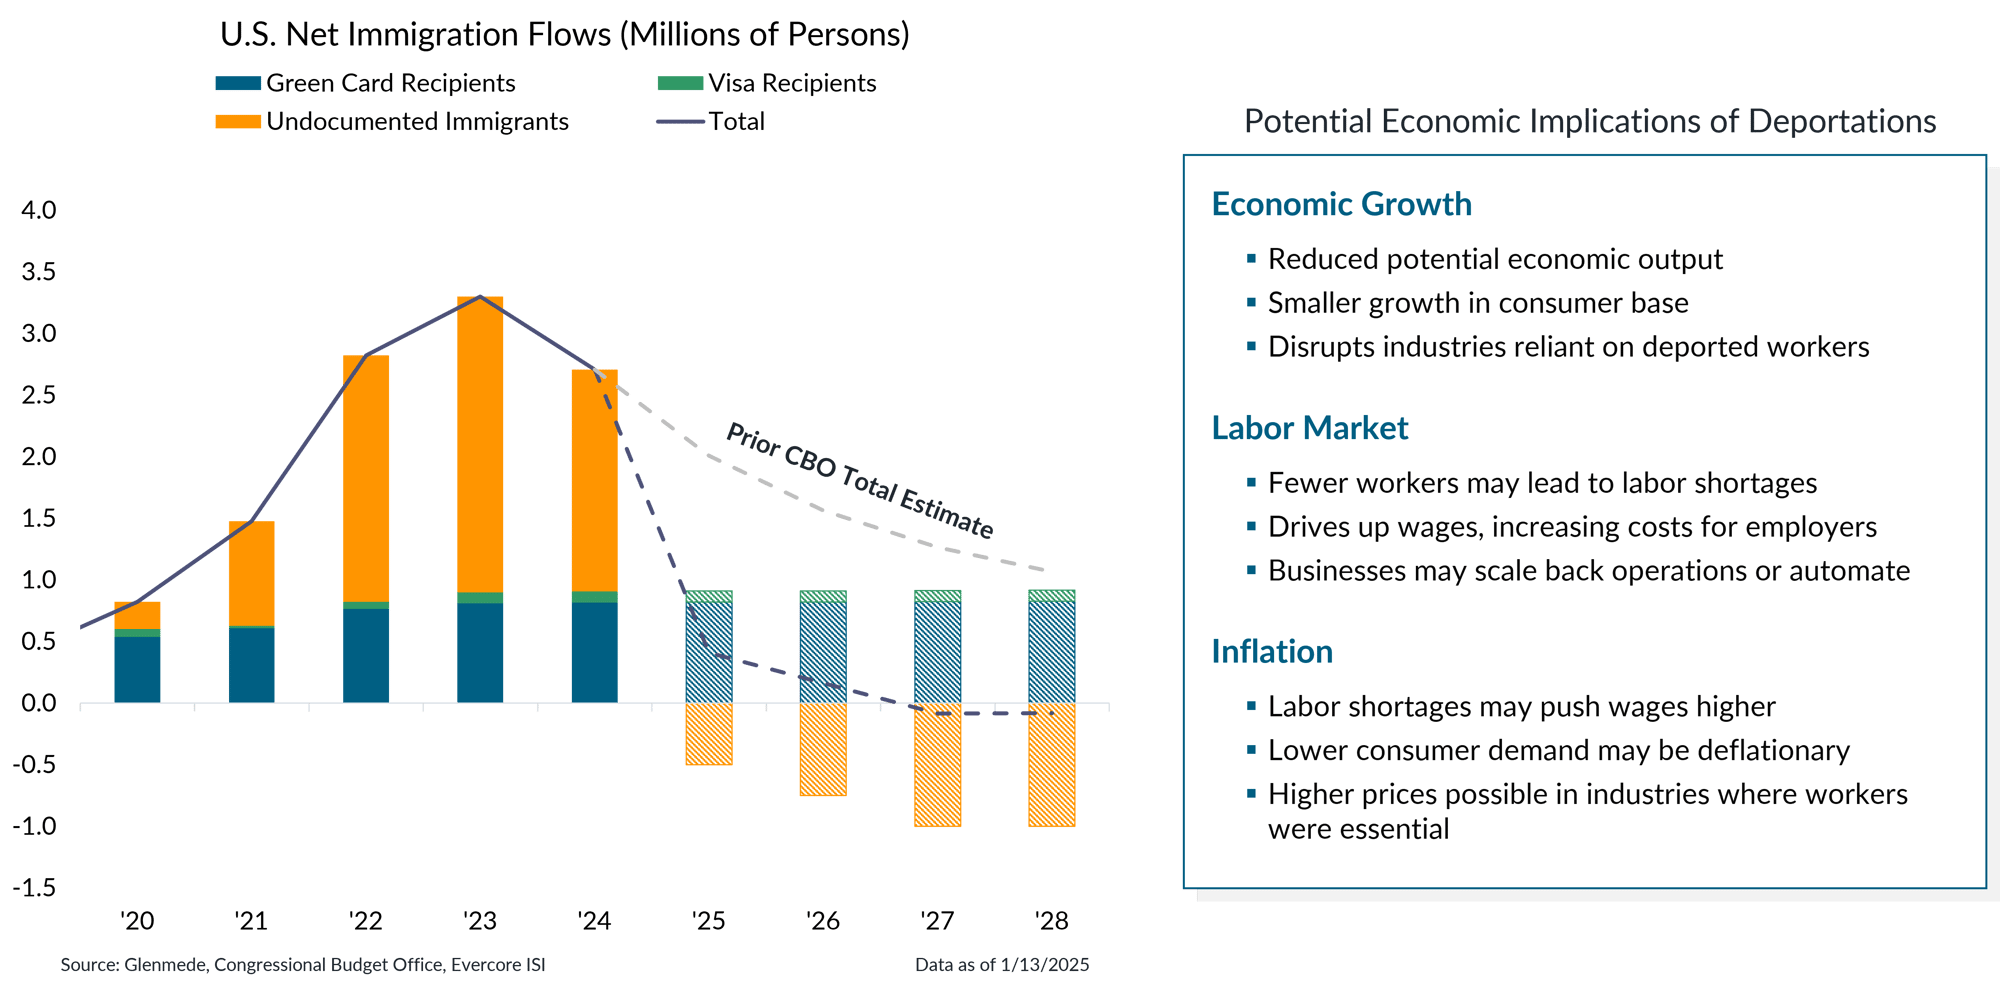
Net immigration, recently an economic growth tailwind, may soon become a deportation-driven headwind

Data shown in the left panel are U.S. net immigration flows in millions of persons, broken down into three categories: green card recipients refers to permanent residents, visa recipients refers to Immigration and Nationality Act (INA) nonimmigrants (which includes temporary workers, students, business travelers and tourists) and undocumented immigrants. Solid bars and lines represent actual results. Hashed bars and dashed lines represent projections based on analyses from the Congressional Budget Office and Evercore ISI. Actual results may differ materially from projections.
- The administration’s immigration policies are expected to significantly reduce the net flow of persons entering the U.S. after a significant acceleration over the past few years.
- This could lead to a shrinking labor force, reduced consumer spending, accelerated wage growth and additional pressure on an already tight labor market.
This material is intended to review matters of possible interest to Glenmede Trust Company clients and friends and is not intended as personalized investment advice. When provided to a client, advice is based on the client’s unique circumstances and may differ substantially from any general recommendations, suggestions or other considerations included in this material. Any opinions, recommendations, expectations or projections herein are based on information available at the time of publication and may change thereafter. Information obtained from third-party sources is assumed to be reliable but may not be independently verified, and the accuracy thereof is not guaranteed. Outcomes (including performance) may differ materially from any expectations and projections noted herein due to various risks and uncertainties. Any reference to risk management or risk control does not imply that risk can be eliminated. All investments have risk. Clients are encouraged to discuss any matter discussed herein with their Glenmede representative.

Feature one
Use text and images to tell your company’s story. Explain what makes your product or service extraordinary.

Feature two
Use text and images to tell your company’s story. Explain what makes your product or service extraordinary.

Feature three
Use text and images to tell your company’s story. Explain what makes your product or service extraordinary.

