Investment Strategy Brief
In the Home Stretch of Earnings Season
August 25, 2024

Executive Summary
- Most of the way through earnings season, Q2 is shaping up to be a solid quarter for profit growth.
- Q2 earnings results have so far exceeded expectations, but that extra growth may have been borrowed from Q3/Q4.
- As 2024 progresses, large caps may pass the earnings growth baton to their smaller counterparts through 2025.
- The prospect for broader earnings growth participation should favor small caps and investment processes that avoid the pitfalls of market concentration.
Most of the way through earnings season, Q2 is shaping up to be a solid quarter for profit growth
%202024-08-26.png?width=2000&height=1930&name=IS%20Brief%20Chart%201%20(Left%20Panel)%202024-08-26.png)
%202024-08-26.png?width=1987&height=2000&name=IS%20Brief%20Chart%201%20(Right%20Panel)%202024-08-26.png)
Shown in the left panel is a timeline of the cumulative share of the S&P 500’s market capitalization that has reported Q2 2024 earnings results. Shown in the right panel is the blended growth in earnings per share for the S&P 500 and its eleven constituent sectors for Q2 2024 on a year-over-year, percent change basis. Blended growth figures combine actual results with consensus expectations for companies that have yet to report. The S&P 500 is a market capitalization weighted index of large cap stocks in the U.S. Actual results may differ materially from expectations. One cannot invest directly in an index.
- The S&P 500 is in the home stretch of earnings season with just a few major companies left to report, including NVIDIA this week.
- Earnings results so far have shaped up relatively well, with 9 of the S&P 500’s 11 constituent sectors expected to post year-over-year profit gains in Q2.
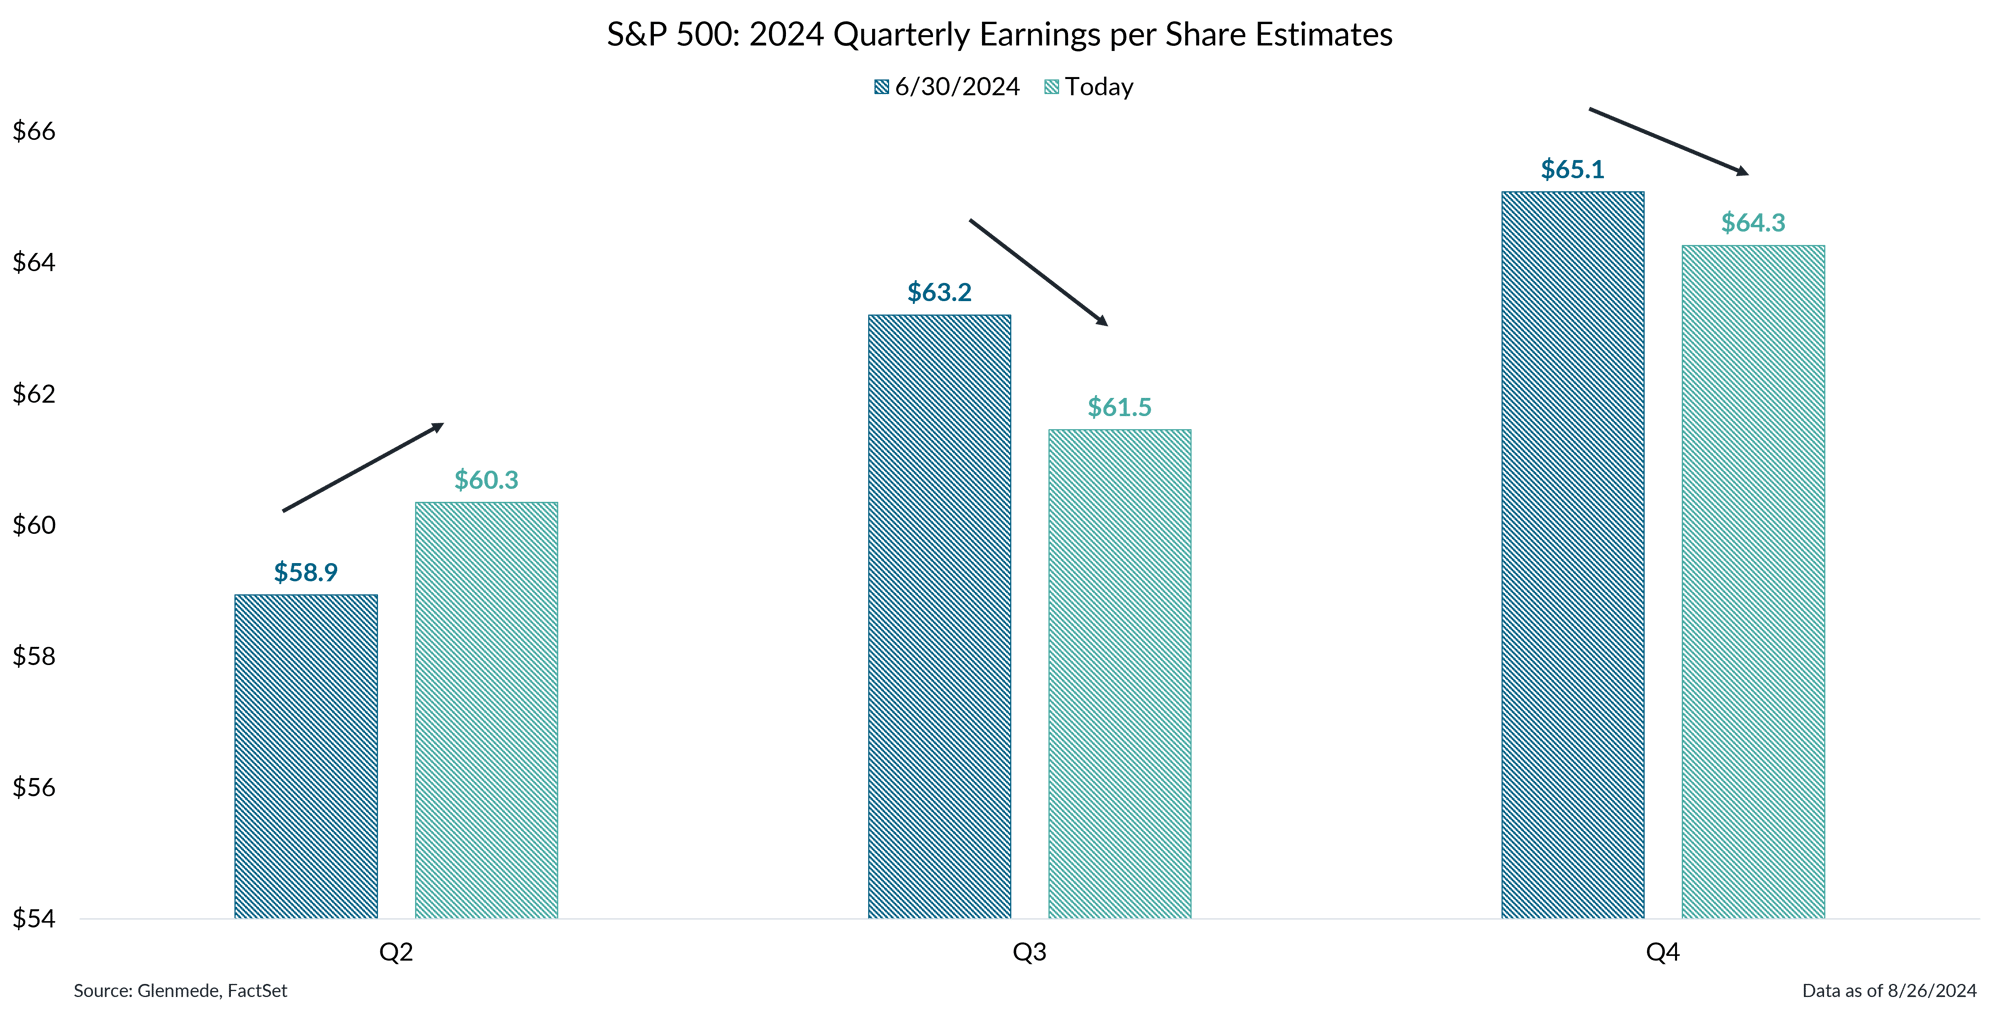
Q2 earnings results have exceeded expectations, but that extra growth may have been borrowed

Data shown are quarterly earnings per share estimates for the S&P 500. The S&P 500 is a market capitalization weighted index of large cap stocks in the U.S. Actual results may differ materially from projections. One cannot invest directly in an index.
- Almost 80% of companies in the S&P 500 have beaten consensus earnings expectations in Q2, leading earnings levels higher than initially thought at the start of the quarter.
- This has coincided with a re-rating of earnings expectations for Q3 and Q4, suggesting that some of the extra earnings growth seen this quarter may have been borrowed from the back half of the year.
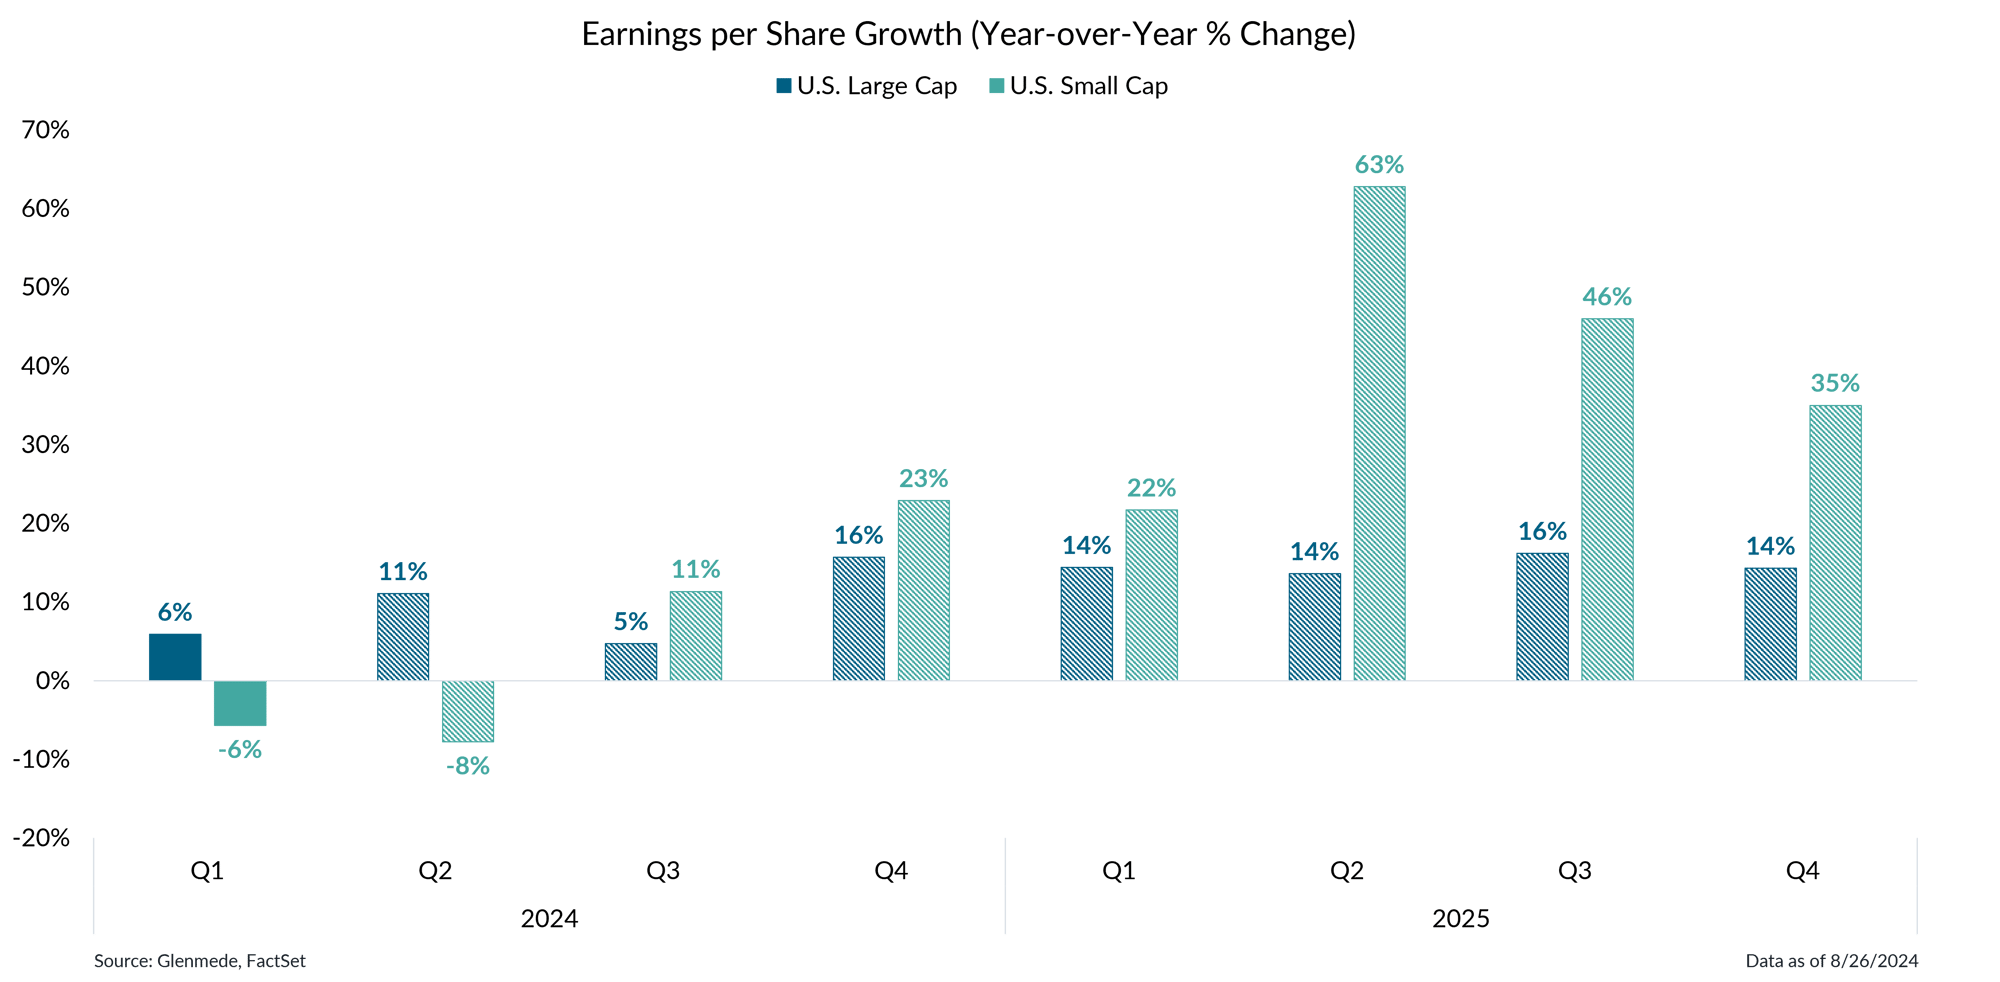
Large caps may pass the earnings growth baton to their smaller counterparts through 2025

Data shown are quarterly earnings per share growth rates on a year-over-year percent change basis. Figures in blue are represented by the S&P 500 index and figures in green are represented by the Russell 2000 index. Solid bars represent actual results and hashed bars represent projections based on bottom-up equity analyst estimates. Past performance may not be indicative of future results. One cannot invest directly in an index.
- Small cap earnings have been through a tough period, which continued through Q2; large cap earnings have grown year-over-year but small cap earnings have fallen.
- Going forward, small caps may begin to flip the script, as they are expected to outearn their larger counterparts handily in each of the next six quarters through year-end 2025.
This material is intended to review matters of possible interest to Glenmede Trust Company clients and friends and is not intended as personalized investment advice. When provided to a client, advice is based on the client’s unique circumstances and may differ substantially from any general recommendations, suggestions or other considerations included in this material. Any opinions, recommendations, expectations or projections herein are based on information available at the time of publication and may change thereafter. Information obtained from third-party sources is assumed to be reliable but may not be independently verified, and the accuracy thereof is not guaranteed. Outcomes (including performance) may differ materially from any expectations and projections noted herein due to various risks and uncertainties. Any reference to risk management or risk control does not imply that risk can be eliminated. All investments have risk. Clients are encouraged to discuss any matter discussed herein with their Glenmede representative.

Feature one
Use text and images to tell your company’s story. Explain what makes your product or service extraordinary.

Feature two
Use text and images to tell your company’s story. Explain what makes your product or service extraordinary.

Feature three
Use text and images to tell your company’s story. Explain what makes your product or service extraordinary.

%202024-08-26.png?width=2000&height=1930&name=IS%20Brief%20Chart%201%20(Left%20Panel)%202024-08-26.png)

