

Investment Strategy Brief | November 8, 2026
Midterm Market Recalibration

Executive Summary
-
Equities are recalibrating as Democratic gains shift attention from election outcomes to the policy agenda ahead.
-
Data center investment could face greater policy scrutiny, particularly at the state level.
-
Recent market weakness has been most pronounced in companies tied to AI infrastructure growth.
-
Post-midterm volatility has been common, but markets have historically recovered over the longer term.
-
Investors should maintain a neutral risk posture, but market volatility may provide opportunities to rebalance portfolios.
The equity market’s long upward march is experiencing a notable pullback
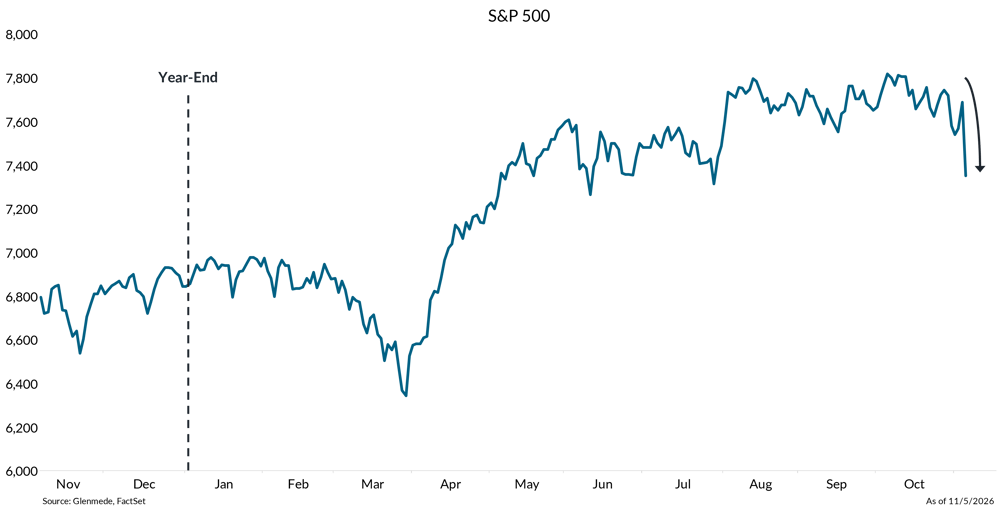
Shown is the S&P 500 which is a market capitalization weighted index of U.S. large cap stocks. Past performance may not be indicative of future results. One cannot invest directly in an index.
-
Equities have experienced a second notable pullback this year, interrupting what had otherwise been a strong upward year-to-date trend.
-
Unlike the earlier geopolitically driven decline, the latest pullback began ahead of the midterms, suggesting recent weakness reflects broader market concerns beyond the election outcome.
Democrats secured both chambers of Congress, shifting attention to the policy agenda ahead
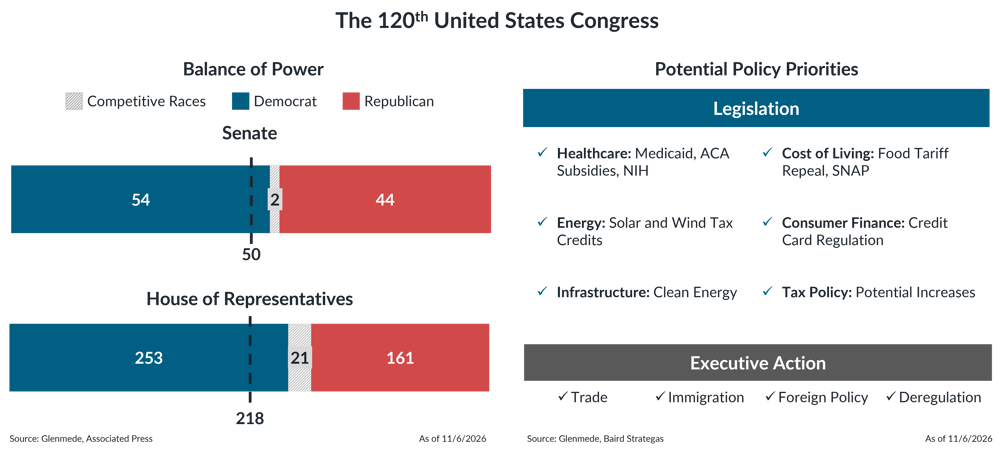
Shown on the left are the results of the 2026 U.S. Senate and House of Representatives midterm elections. Blue and red indicate races called for Democratic and Republican candidates, respectively, while gray indicates races that remain uncalled as of the latest date shown. Shown on the right is a qualitative assessment of potential policy priorities under Democratic control of the Senate and House of Representatives. NIH refers to the National Institutes of Health. SNAP refers to the Supplemental Nutrition Assistance Program. Policy priorities are based on Glenmede’s assessment and may change over time. Actual policy outcomes may differ materially from expectations. Glenmede strives for a nonpartisan approach to its election coverage.
-
A Democratic Congress and a Republican White House wielding its veto authority creates divided government, raising the bar for major legislation and increasing the likelihood of policy gridlock.
-
There may be some areas for bipartisan agreement, including measures aimed at healthcare, cost-of-living pressures, and energy policy.
-
Trade, immigration, foreign policy, and deregulation remain areas where the administration has greater latitude to act and may do so energetically over the next two years.
Democrats now hold the governorships in the states with the largest data center footprints
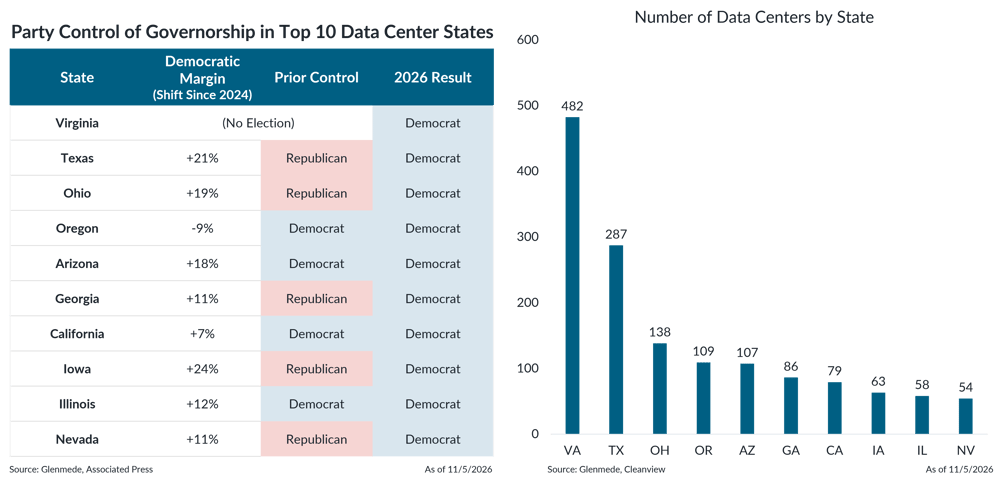
Shown on the left is a list of the ten states with the highest concentration of data center capacity, including the electoral results for those in which the governor’s seat was up for election. The Democratic margin is measured the change President Trump’s 2024 vote margin minus the 2026 Republican gubernatorial margin in each state, as of the latest date shown. Shown on the right is the number of data centers in each state, including both operational facilities and those under construction. Actual results may differ materially from expectations. The data shown are not the opinions of Glenmede and are shown for illustrative purposes only. Glenmede strives for a nonpartisan approach to its election coverage.
-
Gubernatorial races proved particularly consequential this midterm season, with Democrats set to govern the 10 states with the most data centers. Notably Texas, Ohio, Georgia, Iowa, and Nevada shifted from Republican control.
-
With political control shifting across several key data center states, governors could play an increasingly important role in shaping the policy backdrop for future investments.
The boom in data center investment may soon encounter political roadblocks
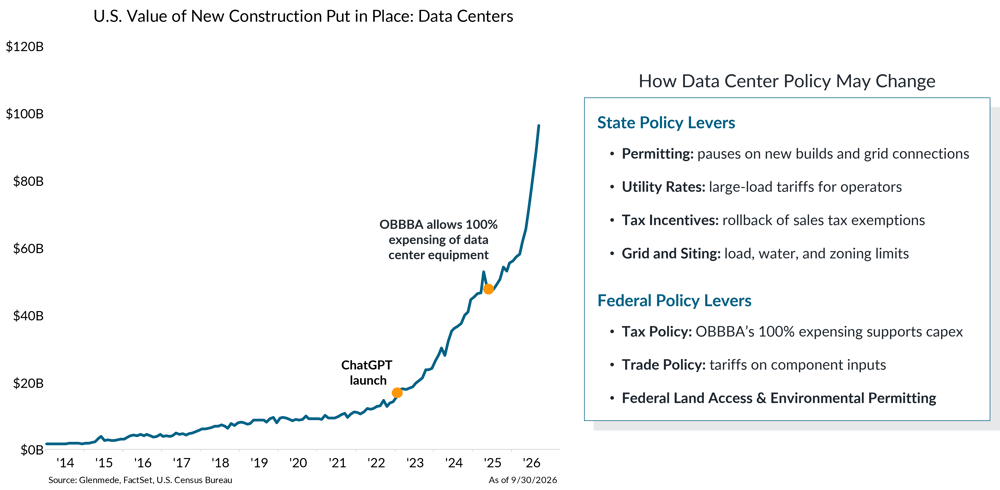
Shown on the left is the value of new U.S. construction put in place for data centers, at a seasonally adjusted annual rate, in billions of dollars. OBBBA refers to the One Big Beautiful Bill Act (OBBBA). Shown on the right are ways data center policy may change at the state and federal level, based on Glenmede’s assessment. Items are illustrative and not exhaustive. Actual results may differ materially from expectations. The data shown are not the opinions of Glenmede and are shown for illustrative purposes only. Glenmede strives for a nonpartisan approach to its election coverage.
-
Data center investment has surged alongside the AI buildout, with the OBBBA’s provisions for 100% expensing providing an additional tailwind.
-
Policymakers now have a range of state and federal levers that could influence the pace of future development. At the state level, tighter policies could ease pressure on power grids and other local resources but may also shift jobs and investment toward states with more favorable policies.
-
At the federal level, changes to tax, trade, land-access, or permitting policies could also affect the economics of new projects. Greater restrictions could help temper the risk of overbuilding but may also slow the pace of U.S. AI infrastructure investment on the margin.
Recent market weakness has been most pronounced in companies tied to ongoing data center growth
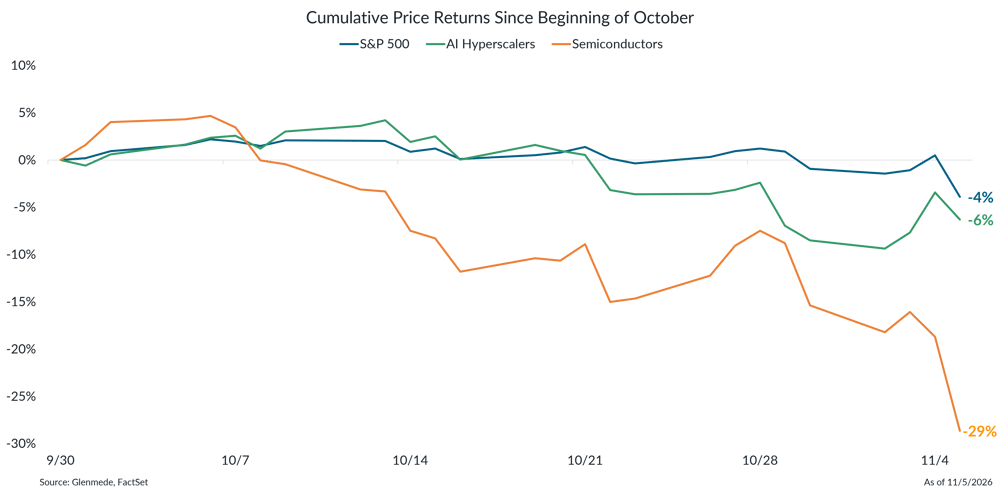
Shown are the cumulative price returns of the S&P 500, a market-capitalization-weighted index of U.S. large-cap stocks, and custom baskets representing AI hyperscalers and semiconductor companies. AI Hyperscalers include Amazon, Alphabet, Meta, Microsoft, Oracle, and Coreweave. Semiconductor stocks are represented by the PHLX Semiconductor Sector Index. Returns are rebased to 0% as of September 30th, 2026. The custom baskets are provided for illustrative purposes only and are not investable indices. Individual securities shown or included in the baskets are not recommendations to buy, hold, or sell those securities. Past performance may not be indicative of future results. One cannot invest directly in an index.
-
Markets have weakened recently, but the pullback has been uneven, with the greatest pressure concentrated in areas tied to AI infrastructure growth.
-
Semiconductor weakness emerged in early October, well ahead of the midterms, suggesting concerns around the pace and sustainability of AI infrastructure investment were already weighing on the sector.
- The election adds another layer of uncertainty, as shifting political control could bring greater scrutiny to the pace, cost, and policy support behind continued data center investment.
Post-midterm volatility has been common, but markets have typically recovered over the longer term
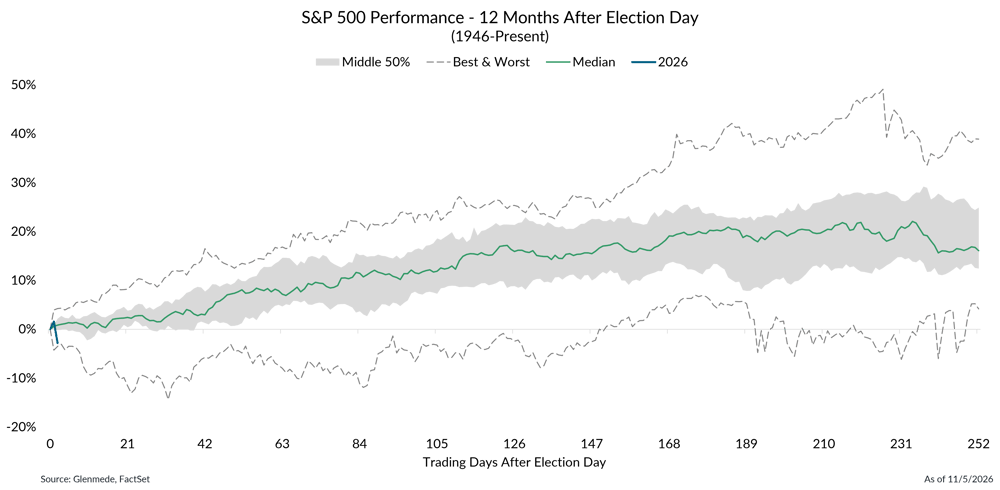
Shown is the historical path of the S&P 500’s total return over the 252 trading days following Election Day across the 20 midterm election years from 1946 to 2022, with the median shown in green, compared with the 2026 path shown in blue through the date indicated. Returns are rebased to 0% at the Election Day close. The shaded area represents the middle 50% of historical outcomes on each trading day, while the dashed lines represent the highest and lowest historical returns. Past performance may not be indicative of future results. One cannot invest directly in an index. Actual results may differ materially from expectations.
-
Volatility following midterm elections has been common, with historical outcomes varying widely in the weeks and months immediately after Election Day.
-
Despite that volatility, all 20 midterm election periods since 1946 ended with positive S&P 500 returns one year after Election Day. While past is not always prologue, it points to a pattern of volatility associated with recalibrating the policy outlook coupled with longer term resilience.
-
Investors should maintain a neutral risk posture, but market volatility may provide opportunities to rebalance portfolios.
For more in-depth information on this topic, please reach out to your Glenmede Relationship Manager.

This material is provided solely for informational or educational purposes and is not intended as personalized investment advice. When provided to a client, advice is based on the client’s unique circumstances and may differ substantially from any general recommendations, suggestions, or other considerations included in this material. Any opinions, recommendations, expectations, or projections included herein are subject to change, and any potential outcome discussed, including but not limited to performance, legislation, or tax consequence, ultimately may not occur. Information obtained from third-party sources is assumed to be reliable but may not be independently verified, and the accuracy thereof is not guaranteed. Any company, fund, or security referenced herein is provided solely for illustrative purposes and is not a recommendation to buy, hold, or sell it. Any reference to risk management or risk control does not imply that risk can be eliminated. All investments have risk. Readers should contact Glenmede or consult with a financial, investment, tax, legal, or other advisor if they have any questions about this material or want advice or more information.