

Investment Strategy Brief | July 12, 2026
Midterms on
the Horizon

Executive Summary
-
Markets are pricing in a base case midterm election outcome of shifting congressional control.
-
Redistricting efforts could reshape the composition of the House of Representatives.
-
The balance of power remains up for grabs, with close races likely to determine the outcome.
-
Policies tend to be more measured during periods of divided government, supporting market performance.
-
As the midterm elections approach, greater clarity around the policy agenda for the next two years should begin to emerge.
Markets are pricing in a base case midterm election outcome of shifting congressional control
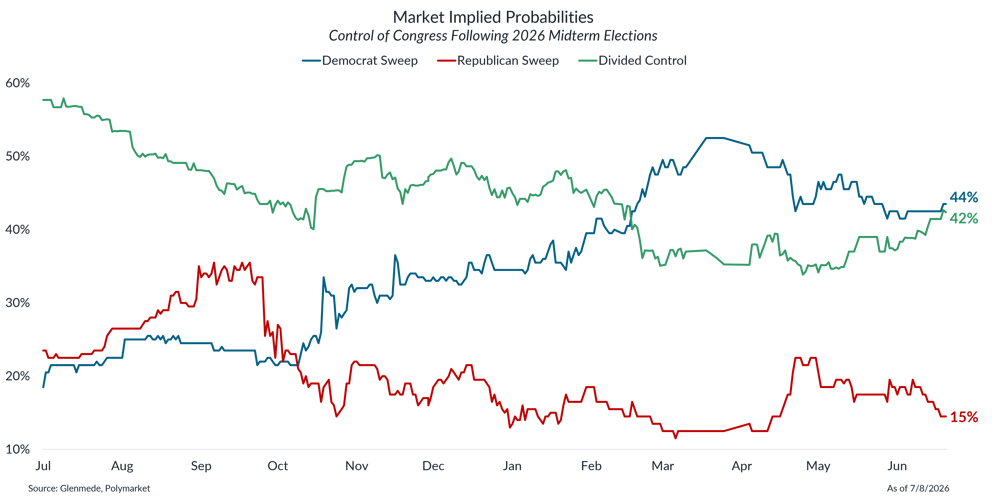
Shown are market-based odds of party control of both chambers of Congress after the results of the 2026 midterm elections via Polymarket. Polymarket is a prediction market where investors can place bets on various future events. References to Polymarket and use of its data herein should in no way be interpreted as an endorsement or recommendation of Polymarket by Glenmede. Probabilities or likelihoods shown are not the opinions of Glenmede. Prediction market data are shown for illustrative purposes only, may have low trading volume, and should not be relied upon as a forecast of actual outcomes.
-
Government policy has had a significant impact on the economy and markets over the last few years; accordingly, the next catalyst for change may be this year’s midterm elections.
-
Prediction markets suggest that investors see some combination in shifting control of Congress, with a base case that Democrats flip control of one or both chambers.
Redistricting efforts could reshape the composition of the House of Representatives
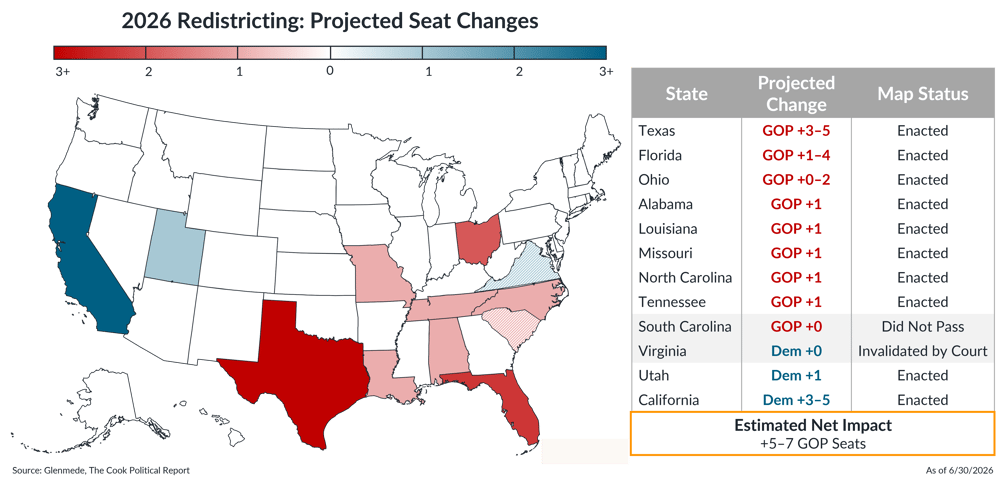
Shown is a map highlighting states where redistricting activity or legal challenges could affect congressional boundaries, alongside a table illustrating the estimated number of House seats that could change based on current ratings from the Cook Political Report. Estimates are illustrative and subject to change as district maps are finalized, challenged, or revised.
-
Republicans currently hold a small majority in the House of Representatives, so control for the 120th Congress may come down to a few close races.
-
Several states have redrawn their maps for the upcoming elections (and some unsuccessfully), which could have an impact on the composition of the House.
-
Altogether, the net result could be a +5 to 7 seat swing in favor of Republicans.
The balance of power remains up for grabs, with close races likely to determine the outcome
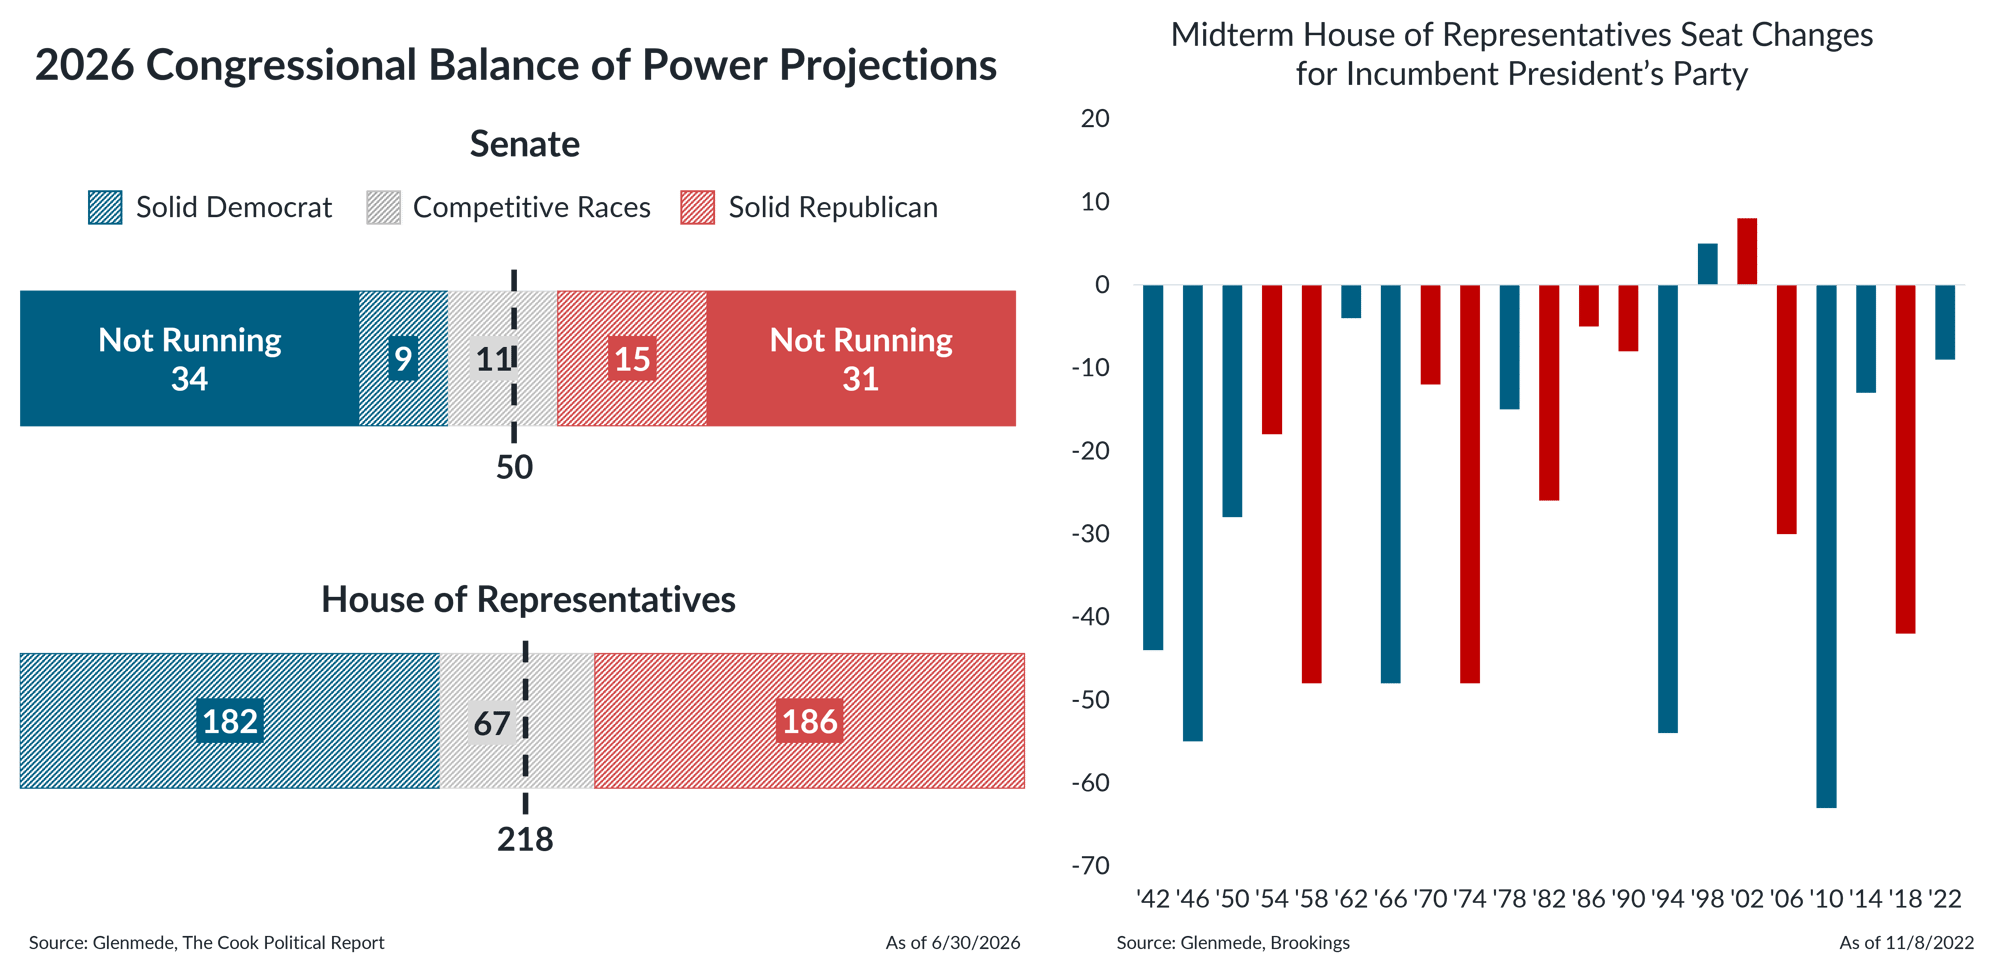
Shown on the left are current race projections for the U.S. Senate and House of Representatives. Competitive races include both races that lean Democrat or Republican as well as toss-up races as rated by the Cook Political Report. Shown on the right are the numbers of seats in the House of Representatives gained or lost by the incumbent party in each midterm election since 1942. Blue bars indicate elections in which Democrats held the White House, while red bars indicate elections in which Republicans held the White House. Actual results may differ materially from expectations. The information shown is not the opinions of Glenmede and are shown for illustrative purposes only.
-
Despite the potential tailwind from redistricting in the House, history shows that the party controlling the White House has tended to lose seats in midterm elections, as has been the case in 19 of the last 21.
-
While the Democrats could regain control of the House, the Senate remains a much steeper challenge, with little room for losses in competitive races.
Policies tend to be more measured during periods of divided government, supporting market performance
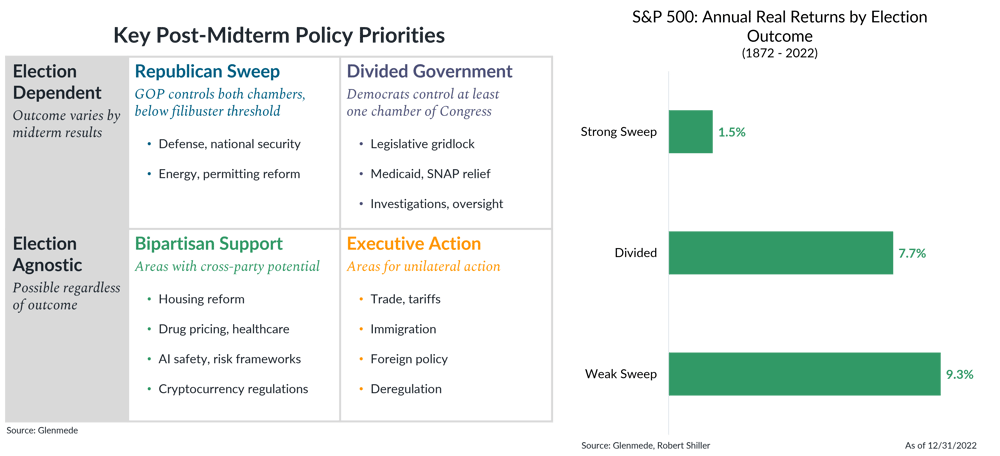
Shown on the left is a qualitative assessment of the legislative and executive agendas for the 120th Congress. Shown on the right are returns based on the composition of the White House, Senate, and House of Representatives after each two-year election cycle. Divided refers to periods in which all three are controlled by different parties, Strong Sweep refers to periods in which one party controls all three and has a large enough majority in the Senate to end a filibuster via cloture, and Weak Sweep refers to all other periods in which one party controls all three. SNAP refers to the Supplemental Nutrition Assistance Program. The S&P 500 is a market capitalization weighted index of large cap stocks in the U.S. Past performance may not be indicative of future results. One cannot invest directly in an index. Actual results may differ materially from expectations.
-
With a filibuster-proof Senate majority appearing effectively out of reach, the most likely outcomes are either a weak unified government or divided control in Washington.
-
A Republican weak sweep could prioritize areas like defense, energy, and deregulation, while divided government would likely slow major legislation but still leave room for bipartisan action on issues such as housing, healthcare, AI, and crypto regulation.
-
Historically, markets have tended to perform better under those environments, as legislative constraints can provide greater policy stability and moderation.
-
Freed from electoral constraint after the midterms, a lame-duck President Trump may prove emboldened in the areas where the executive acts unilaterally, making executive action as important to watch as the legislative agenda over the next two years.
Markets are heading into the historically flatter pre-election stretch of the midterm cycle
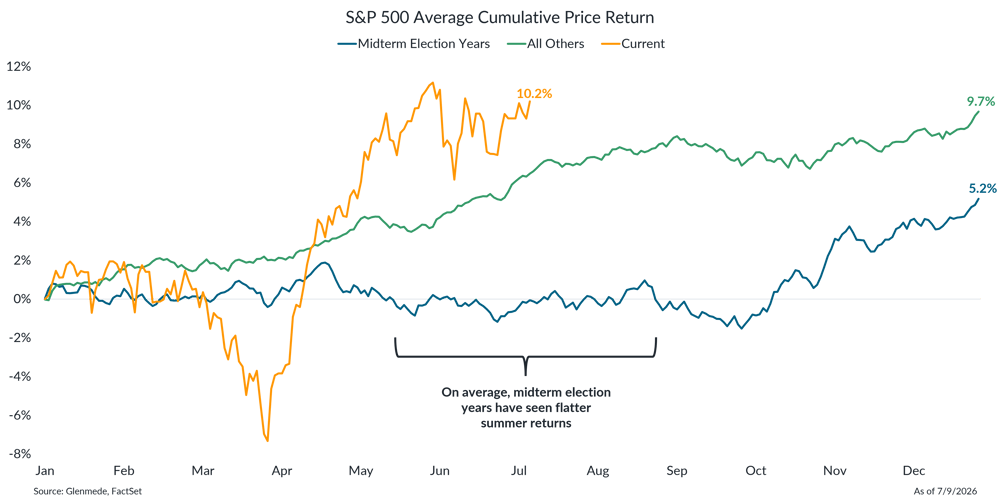
Shown is the average trajectory of cumulative price returns for the S&P 500 during midterm election years in blue compared to non-midterm election years in green and the current trajectory for this year. Each point on the lines represents the average year-to-date return as of that month and trading day and is calculated using daily price returns since 1931. The S&P 500 is a market capitalization weighted index of large cap stocks in the U.S. Past performance may not be indicative of future results. One cannot invest directly in an index.
-
Midterm election years have historically seen flatter market returns through the summer months, though this year’s trajectory is starting off notably stronger than the typical pattern.
-
Historically, periods of midterm election uncertainty have often given way to stronger equity performance as policy and election outcomes become more clear.
For more in-depth information on this topic, please reach out to your Glenmede Relationship Manager.

This material is provided solely for informational and/or educational purposes and is not intended as personalized investment advice. When provided to a client, advice is based on the client’s unique circumstances and may differ substantially from any general recommendations, suggestions or other considerations included in this material. Any opinions, recommendations, expectations or projections herein are based on information available at the time of publication and may change thereafter. Information obtained from third-party sources is assumed to be reliable but may not be independently verified, and the accuracy thereof is not guaranteed. Any company, fund or security referenced herein is provided solely for illustrative purposes and should not be construed as a recommendation to buy, hold or sell it. Outcomes (including performance) may differ materially from any expectations and projections noted herein due to various risks and uncertainties. Any reference to risk management or risk control does not imply that risk can be eliminated. All investments have risk. Clients are encouraged to discuss any matter discussed herein with their Glenmede representative.