Investment Strategy Brief
Navigating the Tariff-Induced Selloff
April 6, 2025

Executive Summary
- Last week’s reciprocal announcement was more forceful than many expected, leading to meaningful market volatility.
- The estimated impact of these tariff rate adjustments is a notable ~2% of GDP, raising the odds of recession to 40 – 50%.
- Challenges in court/Congress, responses from trade partners and offsetting tax cuts could influence the path from here.
- Markets have already adjusted materially alongside shifting expectations, but the range of paths forward remains wide.
- Investors should take a patient, opportunistic approach to rebalancing amid ongoing volatility and a fluid global trade situation.
Equity markets are experiencing a significant but varied downdraft, a reminder of the benefits of diversification
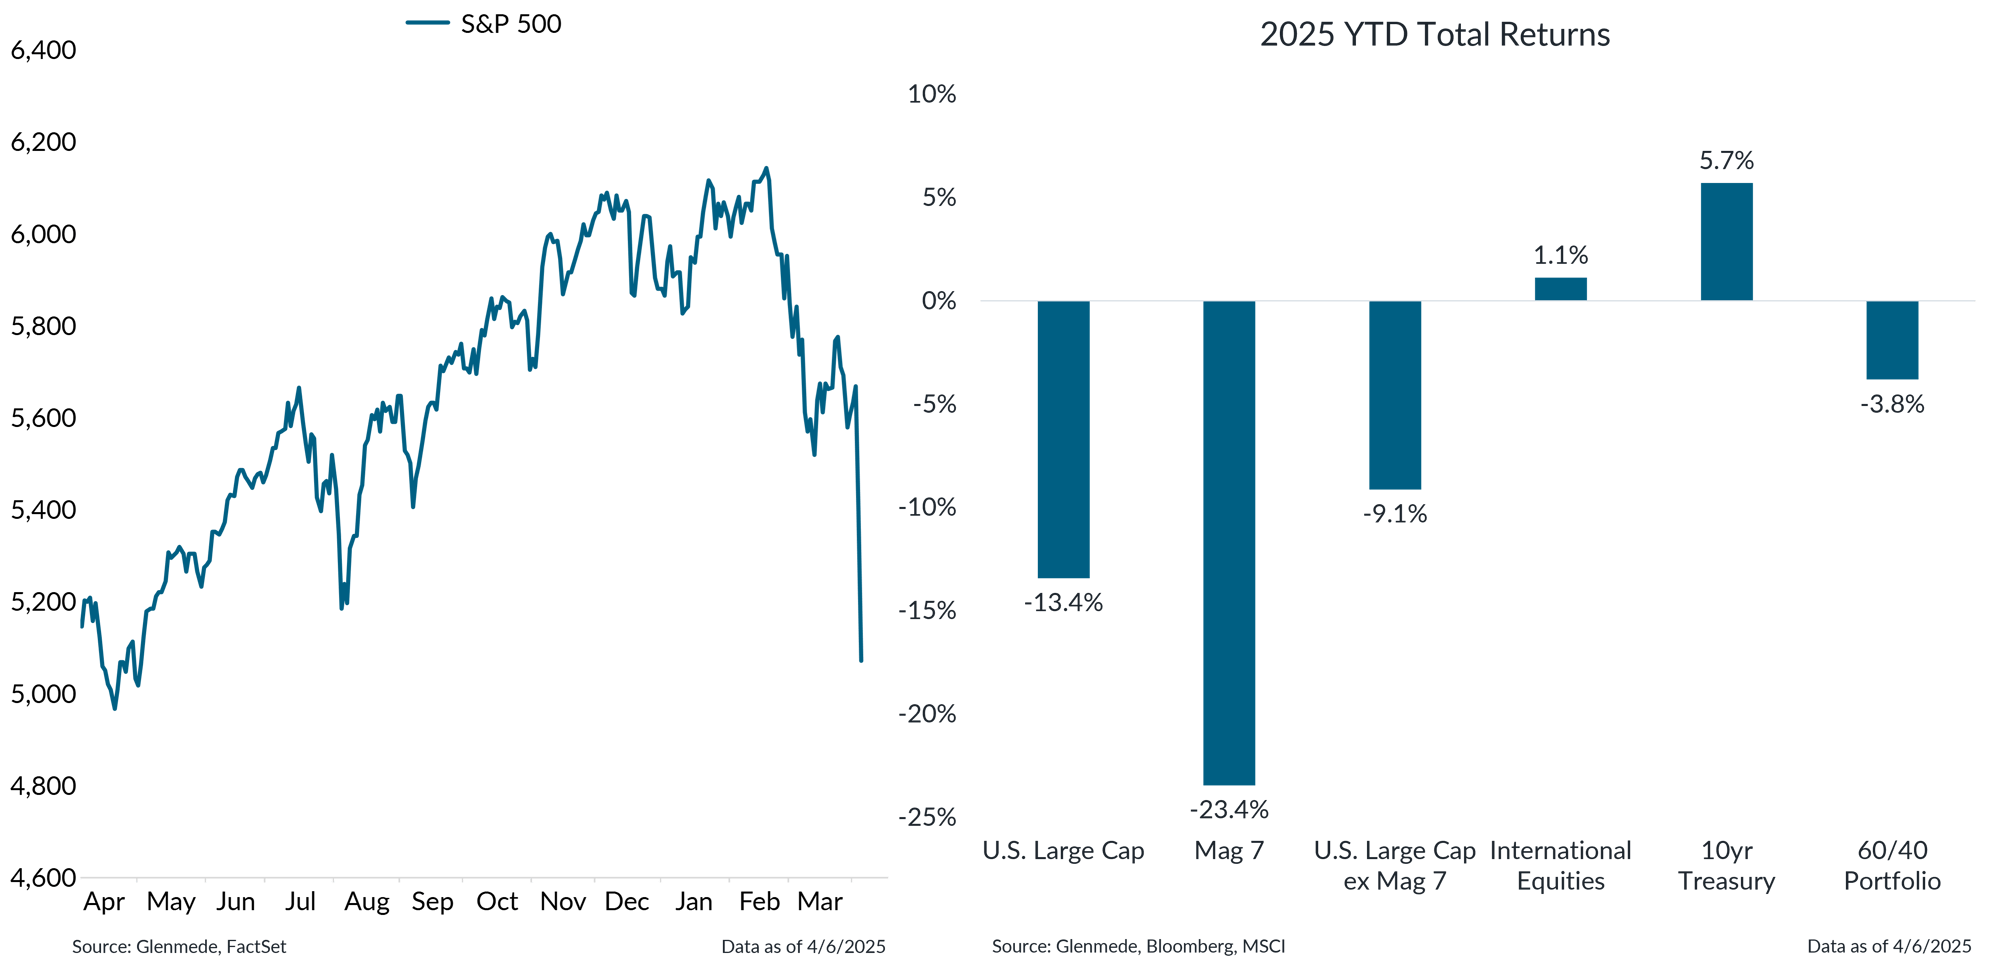
Shown in the left panel is the prior one-year history of the S&P 500 which is a market capitalization weighted index of U.S. large cap stocks. Shown in the right panel are 2025 year-to-date total returns for U.S. Large Cap (S&P 500), International Equities (MSCI All Country World ex-U.S.), Magnificent 7 (Apple, Alphabet, Amazon, Meta, Microsoft, Nvidia, Tesla), U.S. Large Cap ex Magnificent 7 (S&P 500 ex-Mag 7) and 10yr U.S. Treasuries (Bloomberg U.S. Treasury Bellwethers 10Y Index) and 60/40 Portfolio (60% MSCI ACWI, 40% Bloomberg U.S. Aggregate). References to individual securities should not be construed as a recommendation to buy, hold or sell. Past performance may not be indicative of future results. One cannot invest directly in an index.
- Returns for different cohorts of equity markets have been varied amid volatility this year. The Magnificent 7 are down far more than the rest of large caps and foreign equities have held up well.
- Bonds have returned to their historical role of providing ballast to portfolios in times of market stress, leading to far better outcomes for portfolios with a diversified asset allocation.
The reciprocal announcement equates to a meaningful increase in effective tariff rates
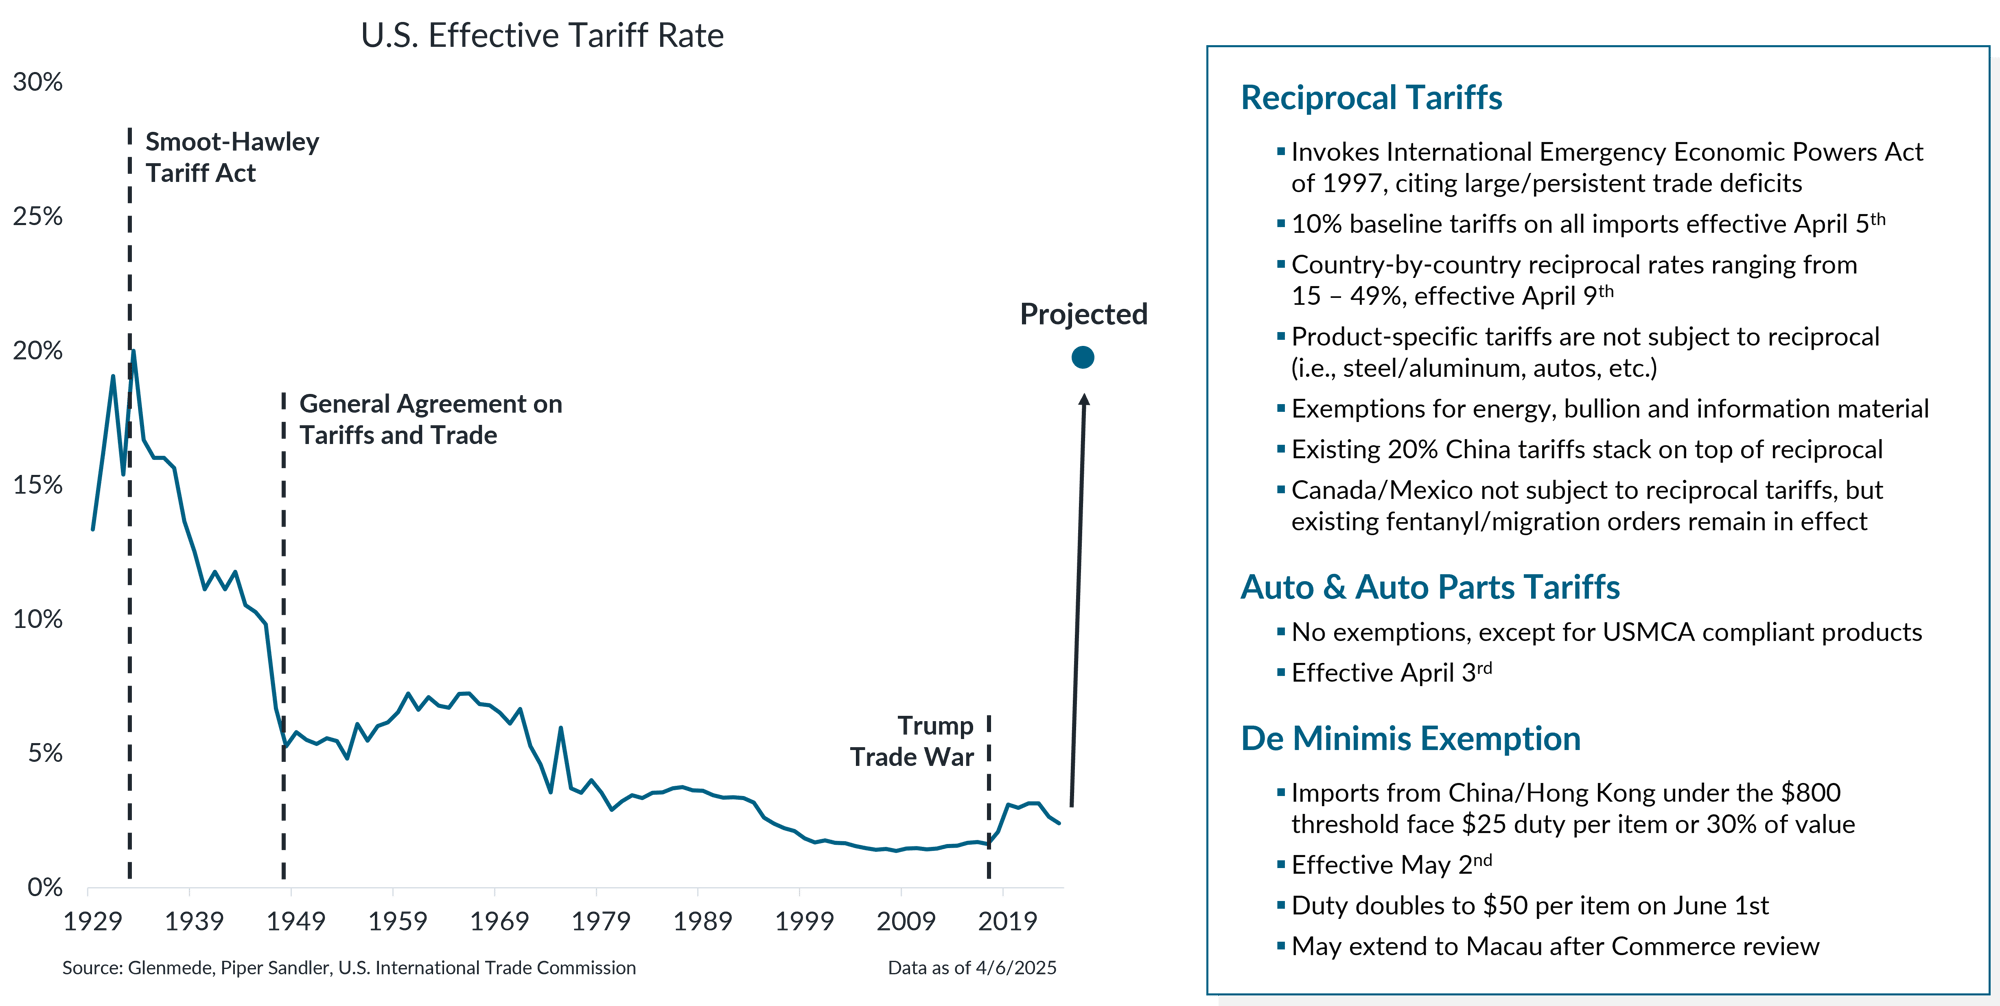
In the left panel are effective tariff rates on U.S. imports over time, which includes nominal tariffs on final goods as well as on imported inputs used in production. The blue dot represents Glenmede’s projection assuming all proposed tariffs are implemented. Shown in the right panel is a summary of trade actions announced on April 2nd, 2025. USMCA refers to the U.S.-Mexico-Canada Agreement. Actual results may differ materially from expectations or projections.
- Last week, the administration announced a base 10% tariff for all countries and country-by-country reciprocal rates ranging from 15–49%.
- Several Asian nations such as China, Taiwan, Vietnam and even Japan will face average duties of over 20%, while most of Europe will now face 20% tariffs.
- This announcement is set to raise the U.S. effective tariff rate to near 20%, surpassing the levels seen during the Smoot-Hawley era in the 1930s.
An aggressive approach to reciprocal tariffs is expected to have an aggregate economic impact of ~2% of GDP
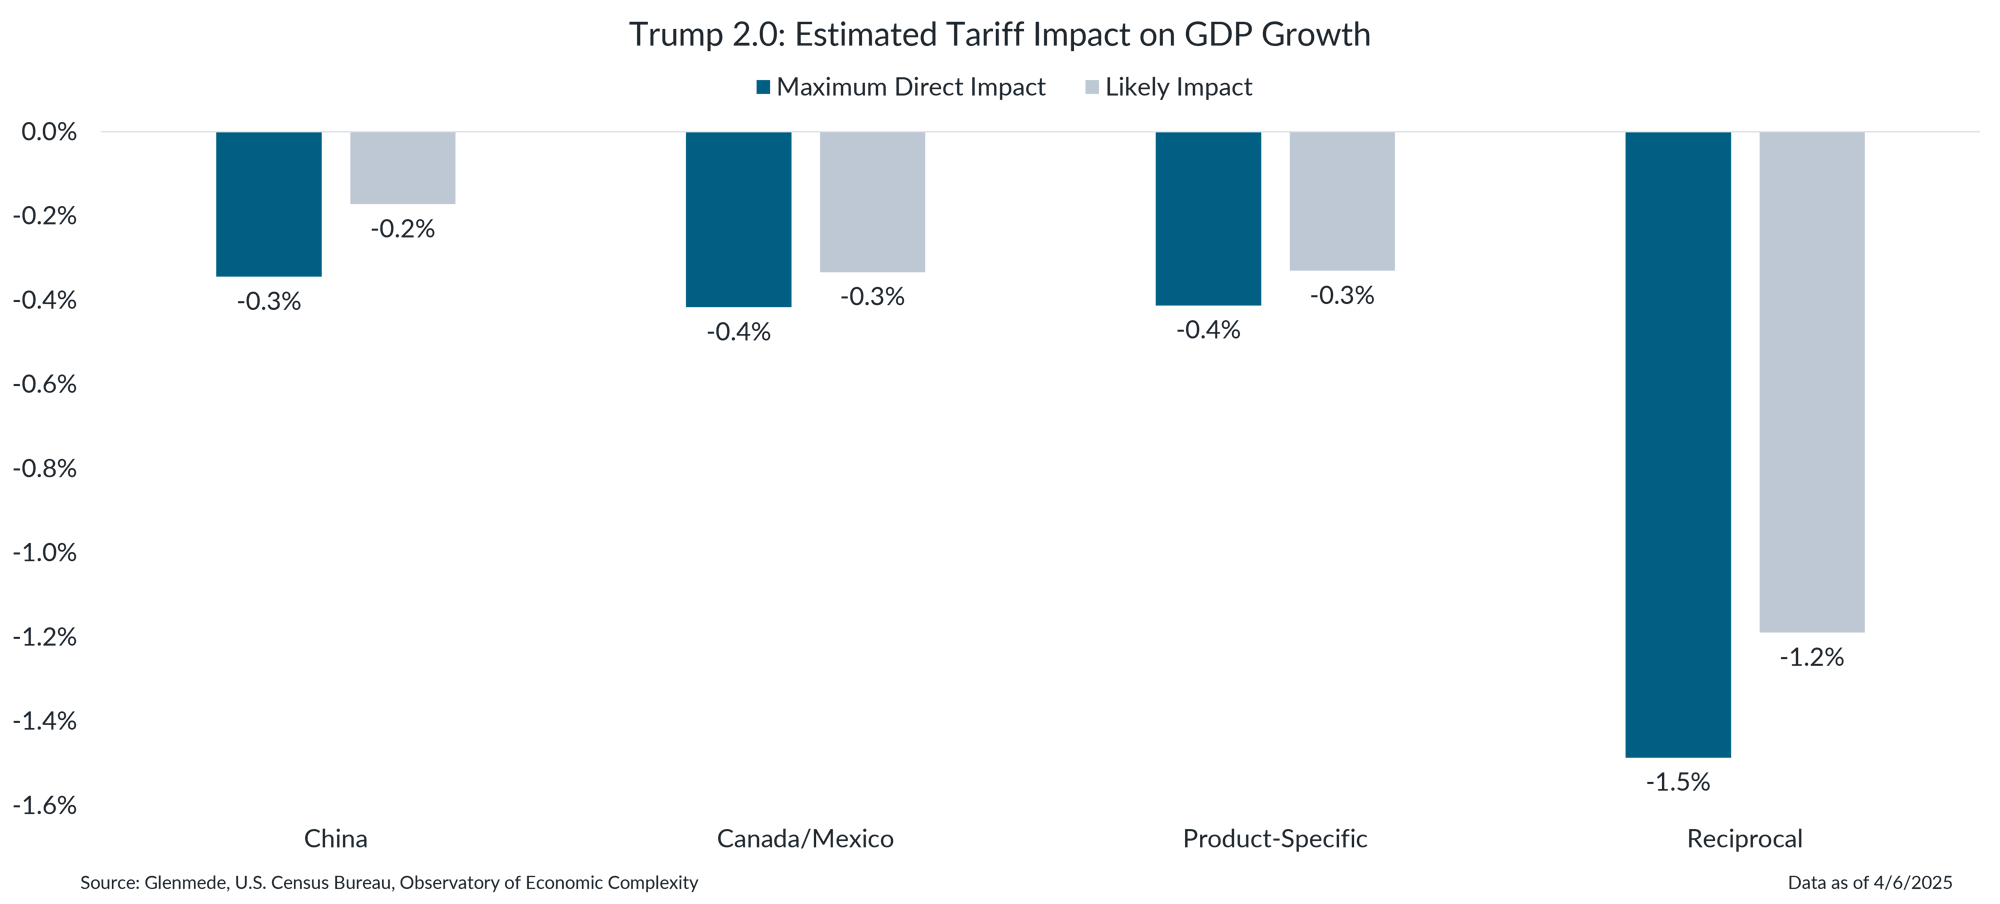
Estimated tariffs reflect the tariff rate applied fully to all associated imports and are shown as a percent of gross domestic product (GDP). China includes 20% country-specific tariffs as well as the revoked De Minimis exemption for imports from China and Hong Kong. Canada/Mexico includes 25% tariffs for USMCA non-compliant imports with a carveout 10% rate for Canadian energy. Product-Specific refers to tariffs on steel, aluminum, copper, lumber, automobiles and parts, pharmaceuticals, semiconductors and European alcohol. Reciprocal refers to global baseline 10% tariffs (except for Canada and Mexico) as well as higher country-specific levies that account for other countries’ tariffs, value-added taxes (VATs), currency manipulation and other non-monetary barriers to trade. The maximum direct economic impact of proposed tariffs assumes full demand destruction via a tariff-induced price shock and that tariffs are implemented fully and in isolation, with no changes to the sourcing of the imports, no other offsetting policies and no retaliatory tariffs. Likely impact accounts for offsetting factors such as reconfigured supply chains and substitution effects. Actual results may differ materially from expectations or projections.
- The new reciprocal tariffs are expected to result in an additional headwind to economic growth of around 1.2% if implemented fully as announced.
- This brings the total tariff-related headwind to GDP near 2.0%, given the pre-existing 0.8% headwind from the China, Canada/Mexico and product-specific tariffs already implemented.
Tariff proposals are increasing the risk of recession, though the path taken from here remains uncertain
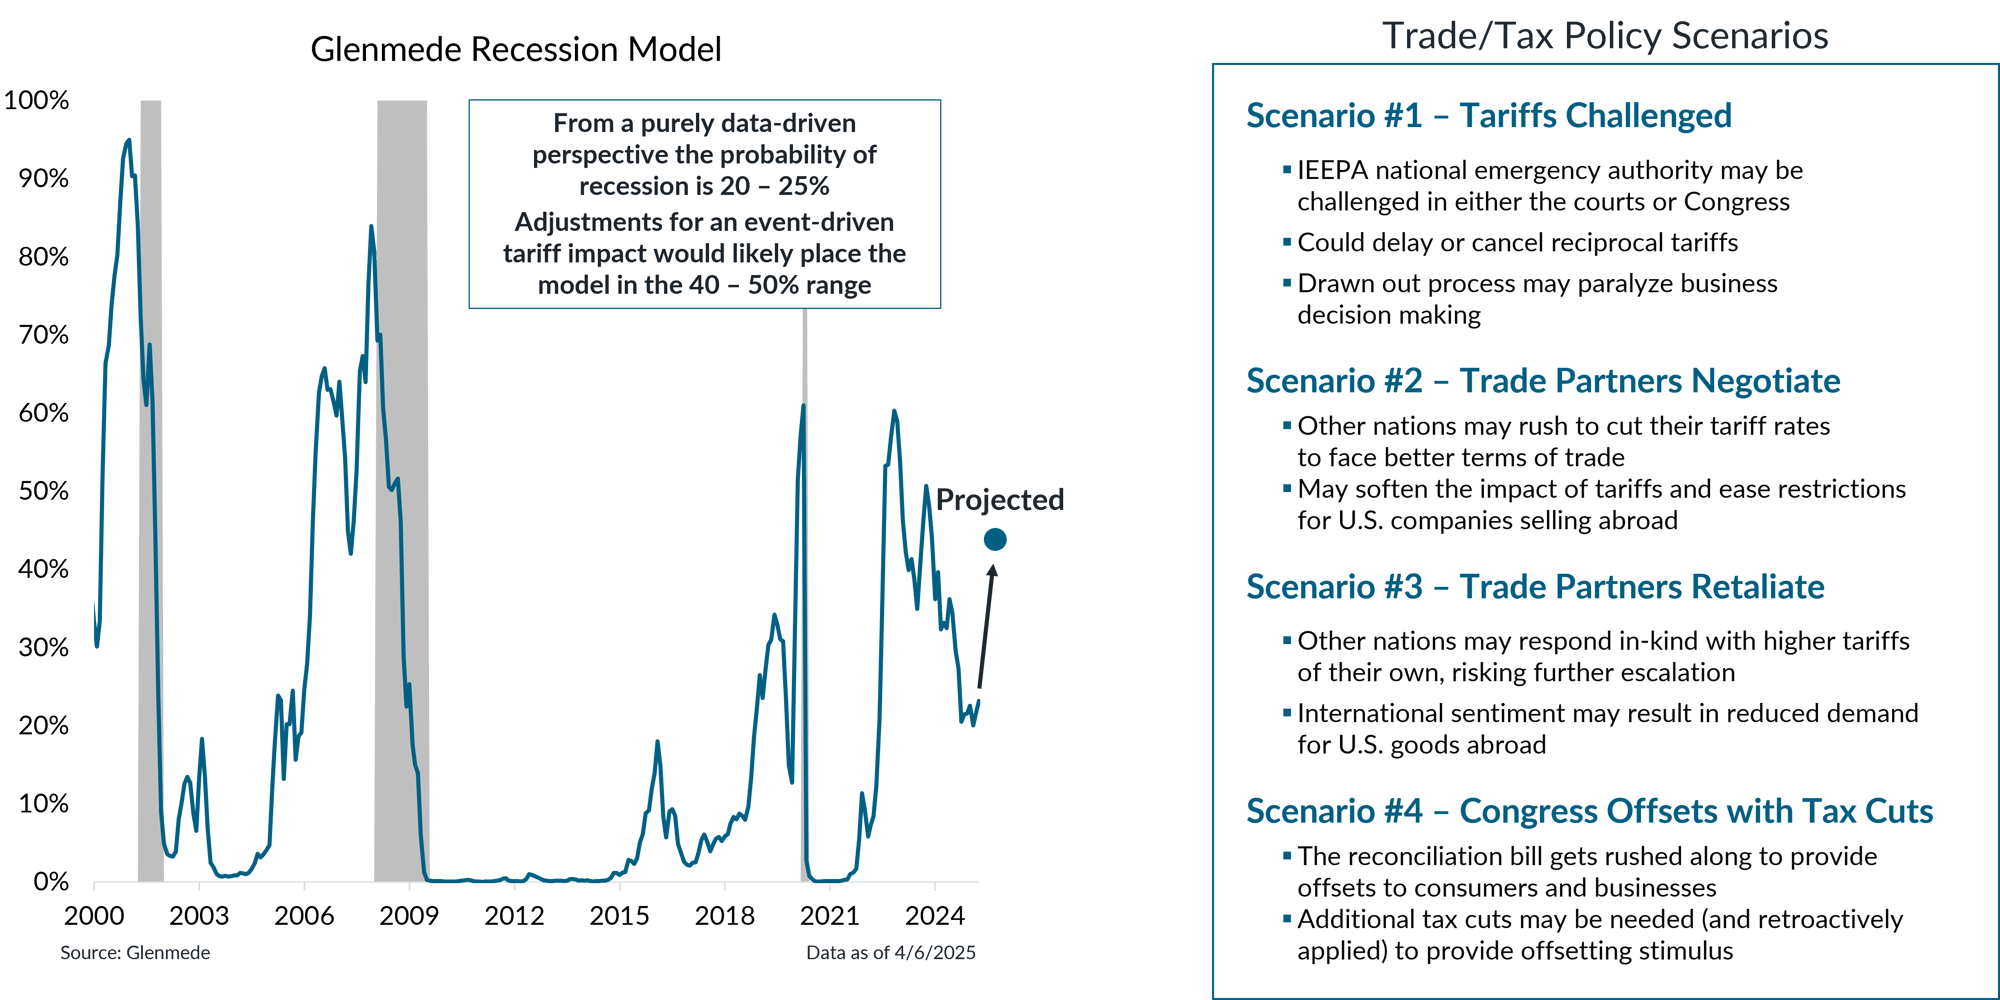
Shown in the left panel is Glenmede’s Recession Model, a tool developed by Glenmede to estimate the probability of a recession in the U.S. occurring within the next 12 months. The model is a balanced mix of (1) long-term excess indicators covering manufacturing, employment and debt balances and (2) near-term leading indicators covering monetary policy, credit markets, business sentiment and other economic trends. Shaded areas represent recession periods of the U.S. economy. Though created in good faith, there can be no guarantee that these indicators will be accurate. The model was established in 2015. The data shown for prior periods represents back-tested results. The scenarios expressed in the right panel are hypothetical. Actual results may differ materially from expectations.
- In the short term, trade policy headwinds are expected to weigh on economic activity, slowing GDP growth toward 0%, and raising the probability of recession this year to 40–50%.
- Although significant uncertainty remains surrounding trade policy, multiple outcomes remain a possibility, including tariffs being challenged in court, trade partners choosing to negotiate or retaliate, or Congress speeding up its timeline to intervene with tax cuts to offset the impact of tariffs.
The economic impact of reciprocal tariffs should force a number of trade partners to the negotiating table
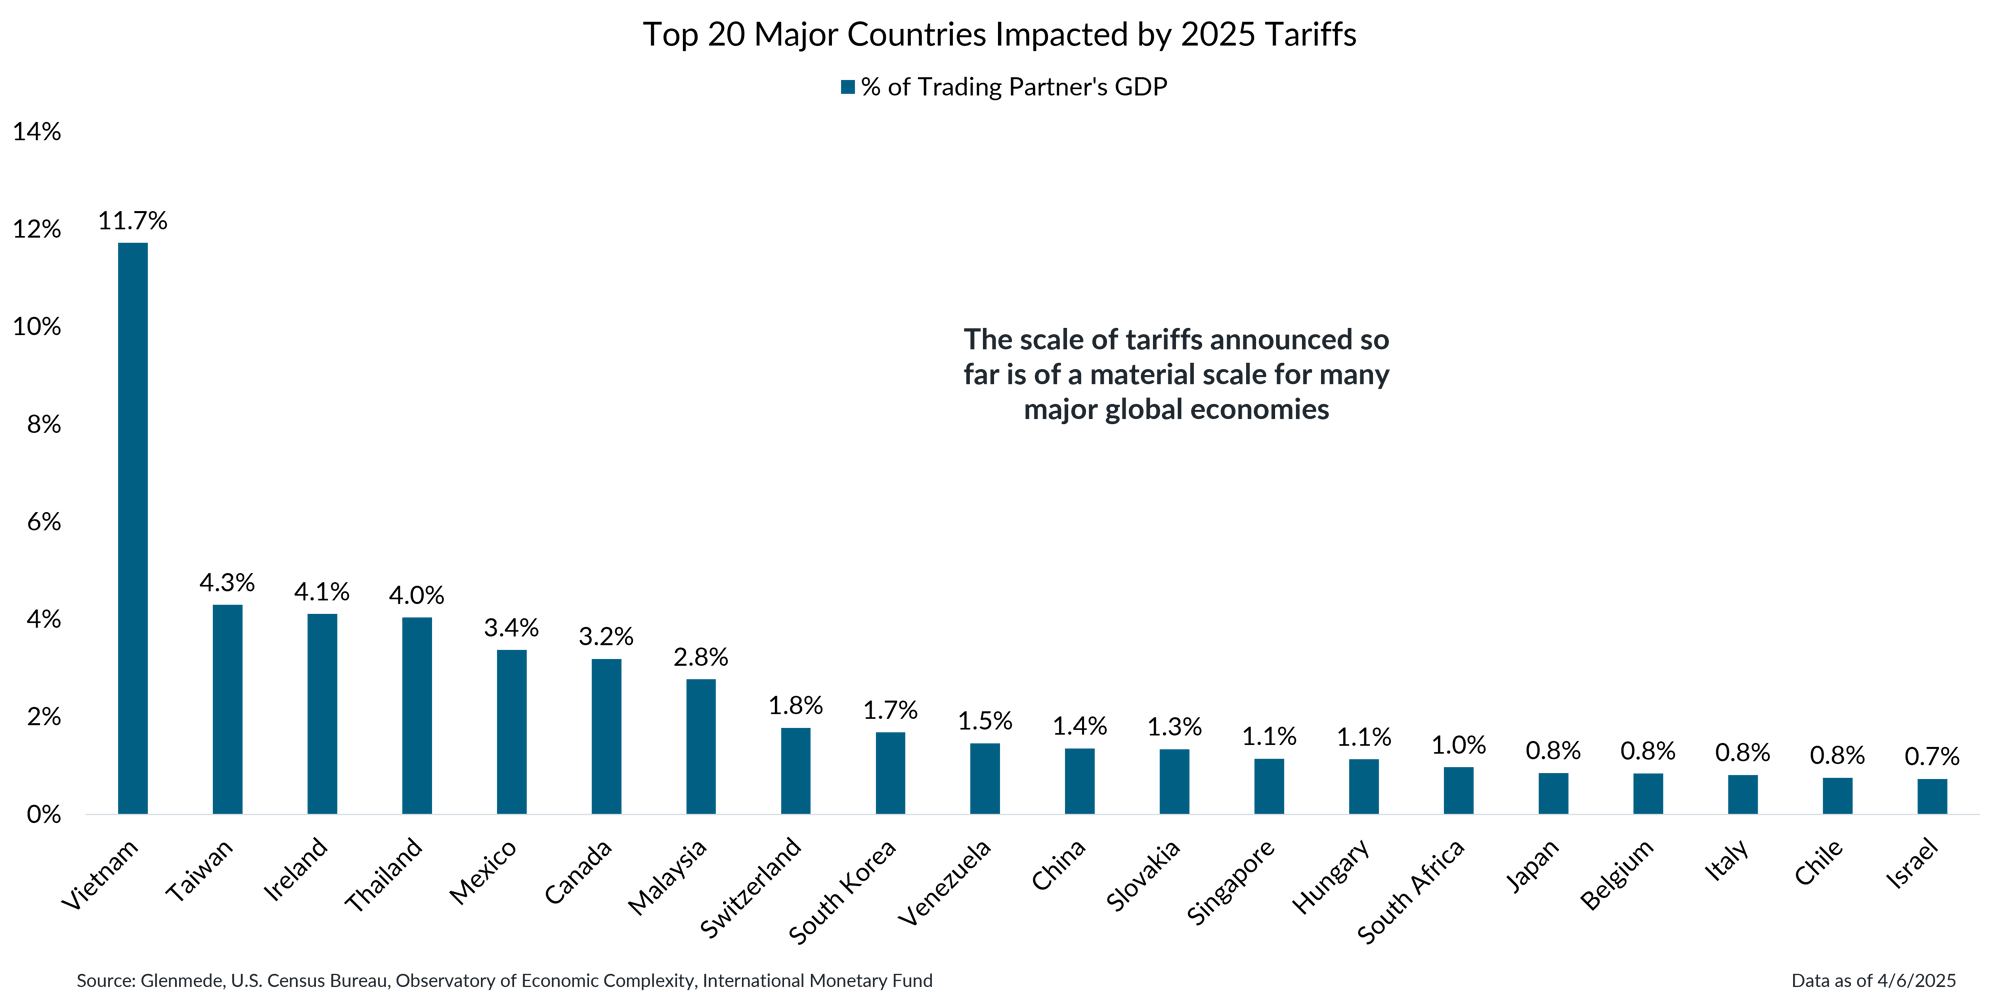
Data shown represent the top 20 major countries by the expected maximum direct impact from all U.S. tariffs announced in 2025 as a percentage of their GDP. Major countries are defined by those with nominal gross domestic product (GDP) greater than $100 billion U.S. dollars. The maximum direct economic impact of proposed tariffs assumes full demand destruction via a tariff-induced price shock and that tariffs are implemented fully and in isolation, with no changes to the sourcing of the imports, no other offsetting policies and no retaliatory tariffs. Actual results may differ materially from expectations.
- Countries that stand to suffer the most significant economic consequences from higher tariffs may find themselves compelled to engage in negotiations to mitigate the impact on their economies.
- Consequently, the U.S. is likely to leverage its negotiating position more effectively with nations where the potential GDP loss from tariffs is substantial.
Declines in U.S. markets have reduced elevated valuations to more normal levels
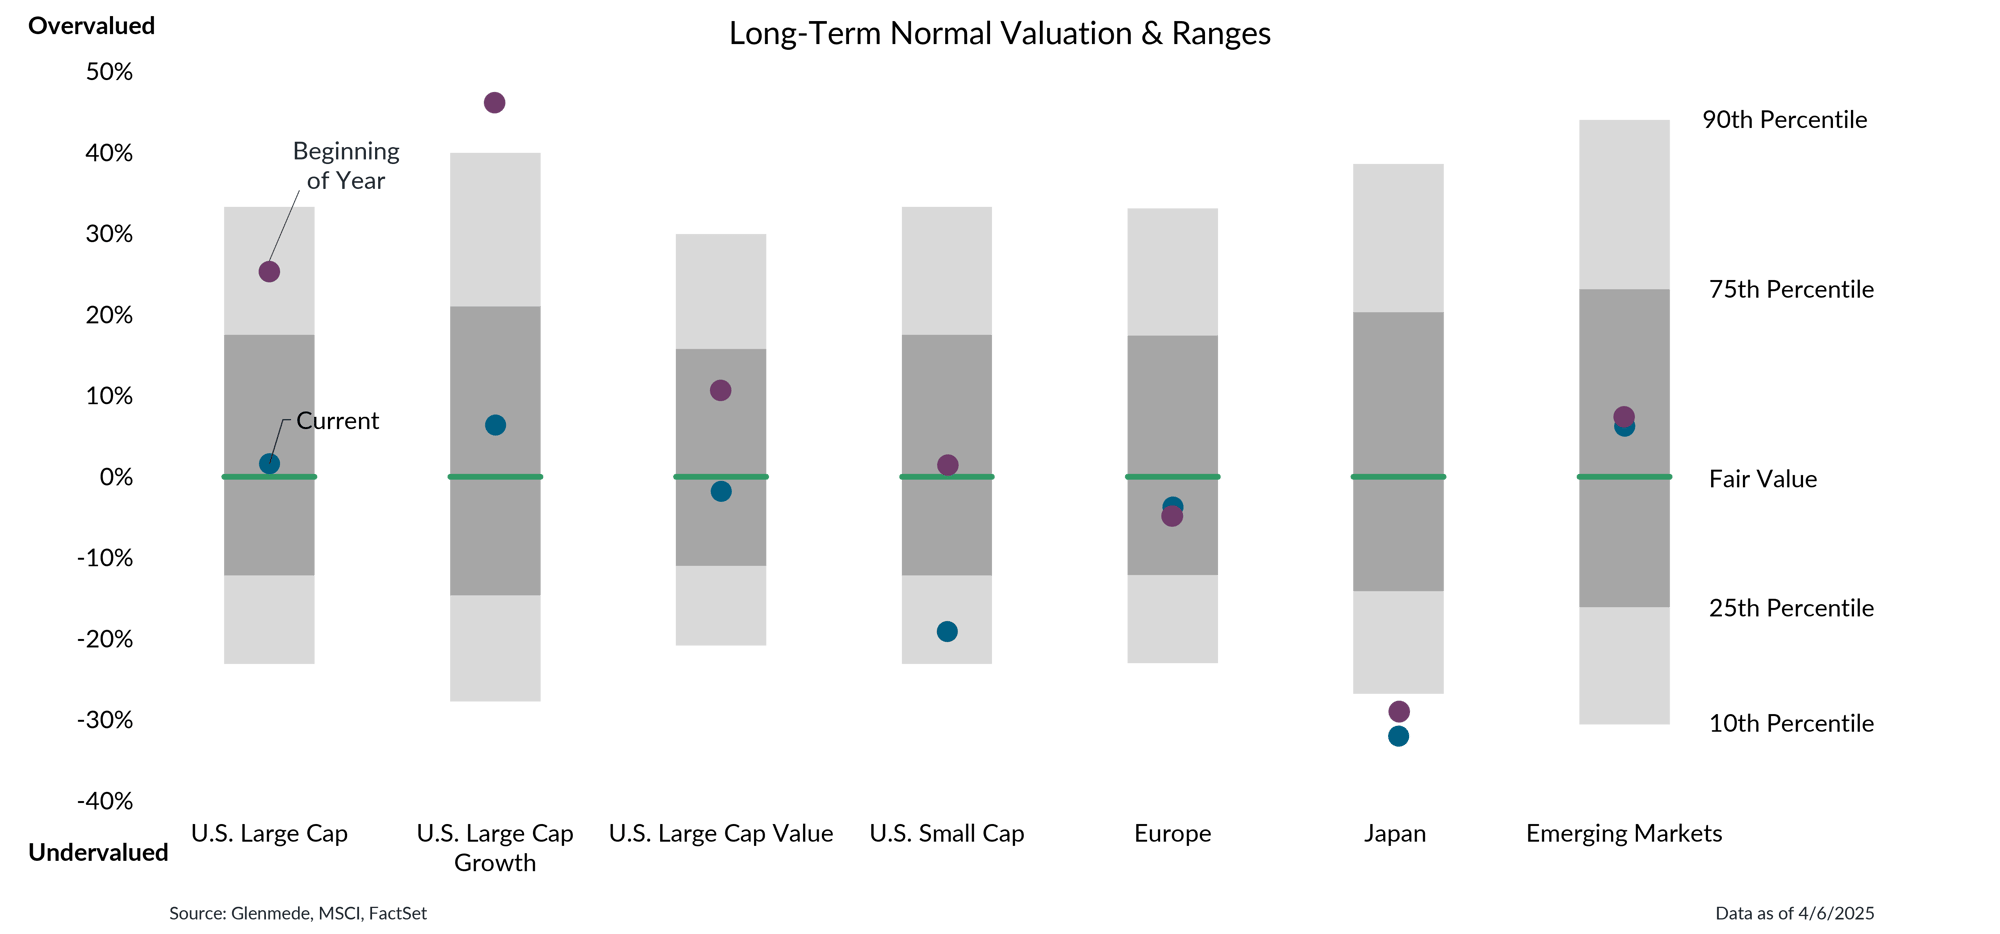
Data shown are Glenmede’s estimates of long-term fair value for U.S. Large Cap (MSCI USA), U.S. Large Cap Growth (MSCI USA Growth), U.S. Large Cap Value (MSCI USA Value), U.S. Small Cap (MSCI USA Small), Europe (MSCI Europe), Japan (MSCI Japan) and Emerging Markets (MSCI EM) based on normalized earnings, normalized cash flows, dividend yield and book value for each index. Blue dots represent current valuation levels and purple dots represent valuation levels at the beginning of 2025. Glenmede’s estimates of fair value are arrived at in good faith, but longer-term targets for valuation may be uncertain. One cannot invest directly in an index.
- As markets have declined in response to tariff announcements, valuations have significantly improved with large cap and large cap growth retreating from their beginning of the year highs.
- Meanwhile, small cap valuations are now at a notable discount, while international markets have experienced modest valuation increases, though they remain close to fair value amid trade uncertainty.
Wholesale market timing can prove costly
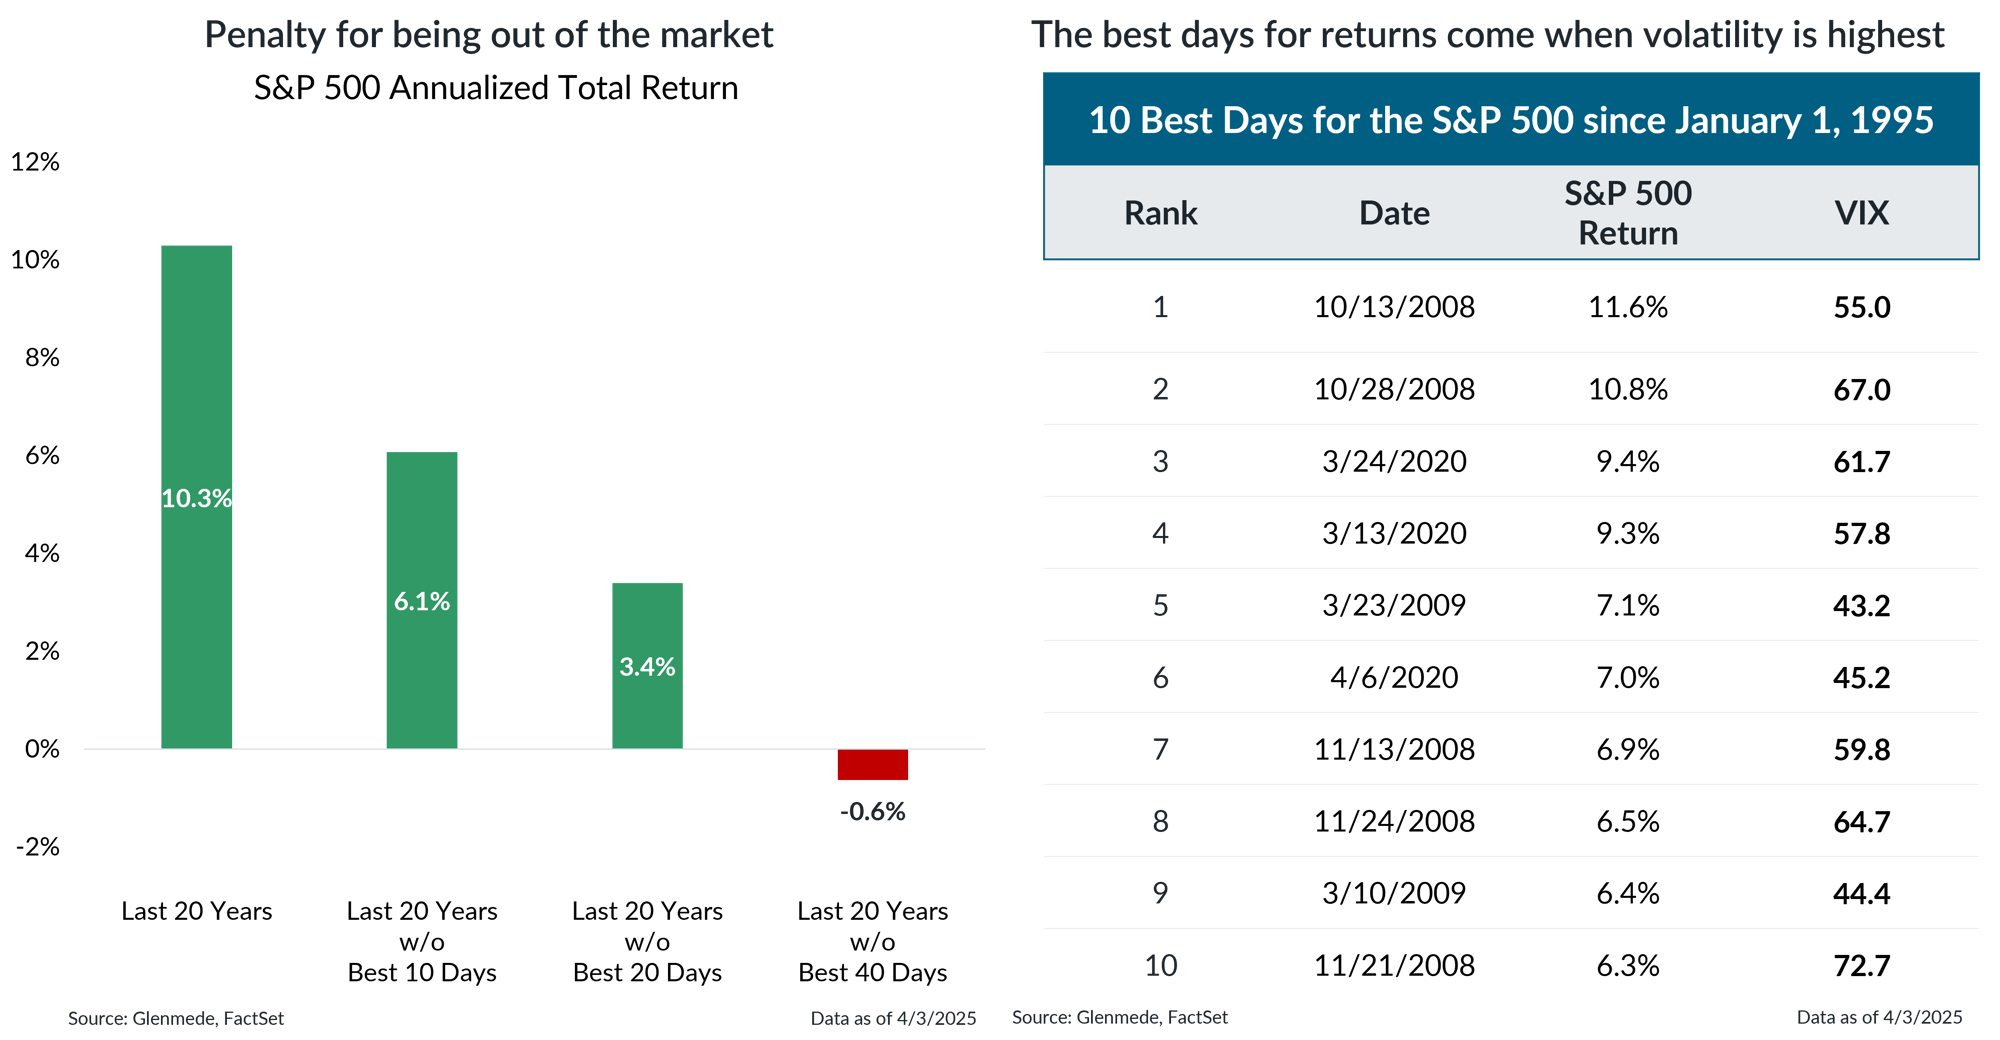
The S&P 500 is a market capitalization weighted index of U.S. large cap stocks. The Chicago Board Option Exchange’s Volatility Index, or VIX for short, is a measure of the market’s expectation of volatility based on derivatives pricing on the S&P 500 Index. Past performance may not be indicative of future results. One cannot invest directly in an index.
- Investors should keep in mind that market timing is very difficult and can prove costly, as some of the best days for equities have come when volatility was at its highest.
- Investors should take a patient, opportunistic approach to rebalancing amid ongoing volatility and a fluid global trade situation.
This material is intended to review matters of possible interest to Glenmede Trust Company clients and friends and is not intended as personalized investment advice. When provided to a client, advice is based on the client’s unique circumstances and may differ substantially from any general recommendations, suggestions or other considerations included in this material. Any opinions, recommendations, expectations or projections herein are based on information available at the time of publication and may change thereafter. Information obtained from third-party sources is assumed to be reliable but may not be independently verified, and the accuracy thereof is not guaranteed. Outcomes (including performance) may differ materially from any expectations and projections noted herein due to various risks and uncertainties. Any reference to risk management or risk control does not imply that risk can be eliminated. All investments have risk. Clients are encouraged to discuss any matter discussed herein with their Glenmede representative.

Feature one
Use text and images to tell your company’s story. Explain what makes your product or service extraordinary.

Feature two
Use text and images to tell your company’s story. Explain what makes your product or service extraordinary.

Feature three
Use text and images to tell your company’s story. Explain what makes your product or service extraordinary.

