Investment Strategy Brief
2025 Outlook: New Year, Same Economic Expansion
December 15, 2024

Executive Summary
- The U.S. economic expansion is hitting a relatively normal fifth year but is already showing classic signs of being late-stage.
- Risks surrounding the Fed’s dual mandate (inflation and employment) are roughly balanced.
- Expect the Fed to slow-walk further rate cuts as it feels its way to a more appropriate, neutral setting for monetary policy.
- Investors should maintain neutral positioning during a late-stage expansion while actively looking to rebalance and diversify portfolios.
Approaching its fifth year, the economic expansion is sitting close to the historical norm
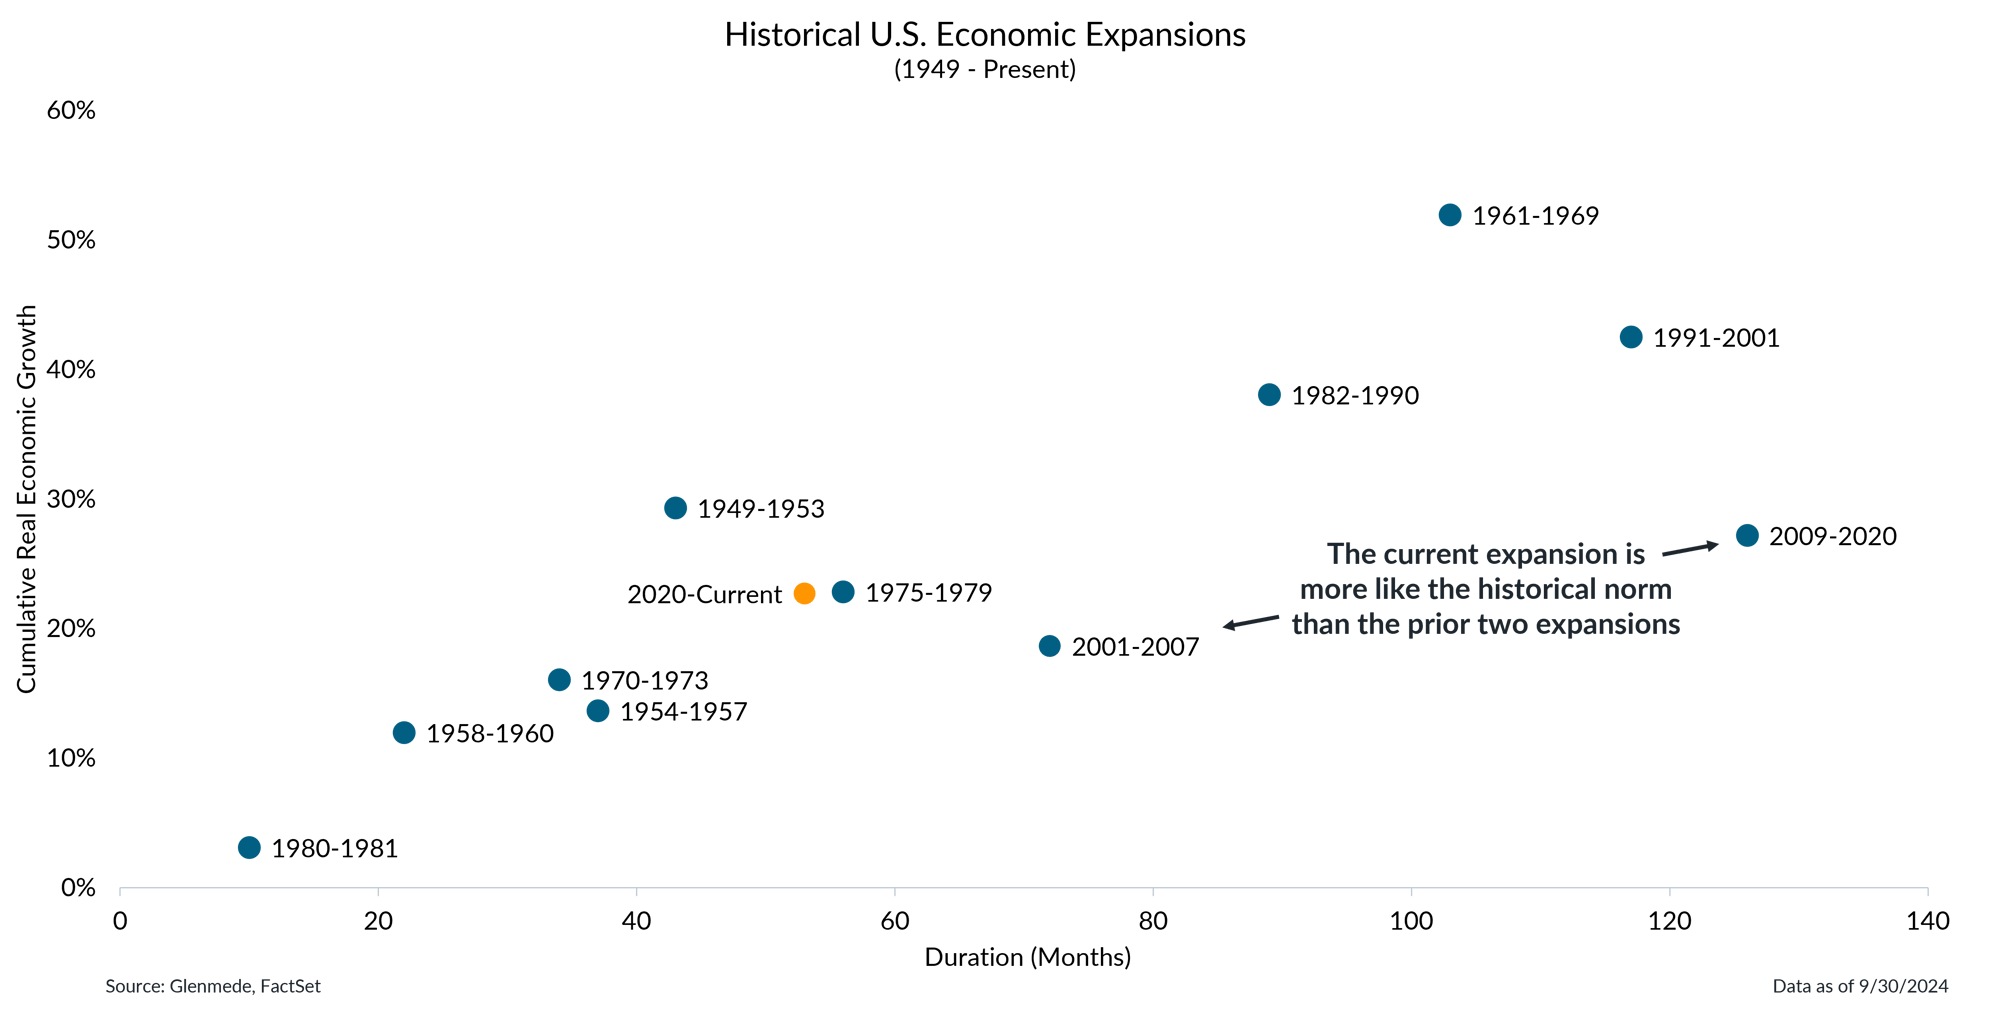
Each dot shown represents an economic expansion in the U.S. (i.e., a period in which the economy experiences sustained growth). Dots are graphed along the x-axis according to their duration (in months) and along the y-axis according to their cumulative real economic growth. Cumulative real economic growth is measured by the total increase in a country's inflation-adjusted output of goods and services (real gross domestic product). Past performance may not be indicative of future results.
- While still relatively young, the current economic expansion has achieved growth levels comparable to those seen in longer historical expansions.
- The ongoing expansion is likely to persist through 2025, with growth dynamics resembling those of prior long-term cycles.
The U.S. economy already shows classic signs of a late-stage expansion
.png?width=2000&height=928&name=2024-12-16%20Slide%202%20(1).png)
Data shown in the left panel is U.S. gross domestic product (GDP), potential GDP and various stages of the economic cycle, measured in trillions of U.S. dollars. Red, green, blue and yellow shaded regions represent periods of Recession and Early Cycle, Mid Cycle and Late Cycle economic expansion in the U.S., respectively. The stages of the economic cycle are defined as the following: Recession refers to periods of economic downturn, Early Cycle to rebounds from recessions, Mid Cycle to ongoing growth up to the economy’s potential and Late Cycle to periods where the economy is operating at or above potential. The visual in the right panel is a qualitative representation of Glenmede’s opinions on how far each component of economic activity is along the spectrum from early to late economic cycle. The left side of the visual shows the typical Early Cycle behavior of the listed sectors of the economy and the right side shows the typical Late Cycle behavior. Potential GDP is the theoretical level of GDP an economy can sustainably produce when operating at full capacity, without causing inflationary pressure.
- The U.S. economy remains in a late-stage expansion, a phase typically marked by positive GDP growth, a tight labor market, elevated inflation and tight monetary policy.
- Stronger-than-normal productivity growth has the potential to provide a tailwind that could help extend this late-stage economic expansion.
Risks surrounding the Fed's dual mandate (inflation and employment) are roughly balanced
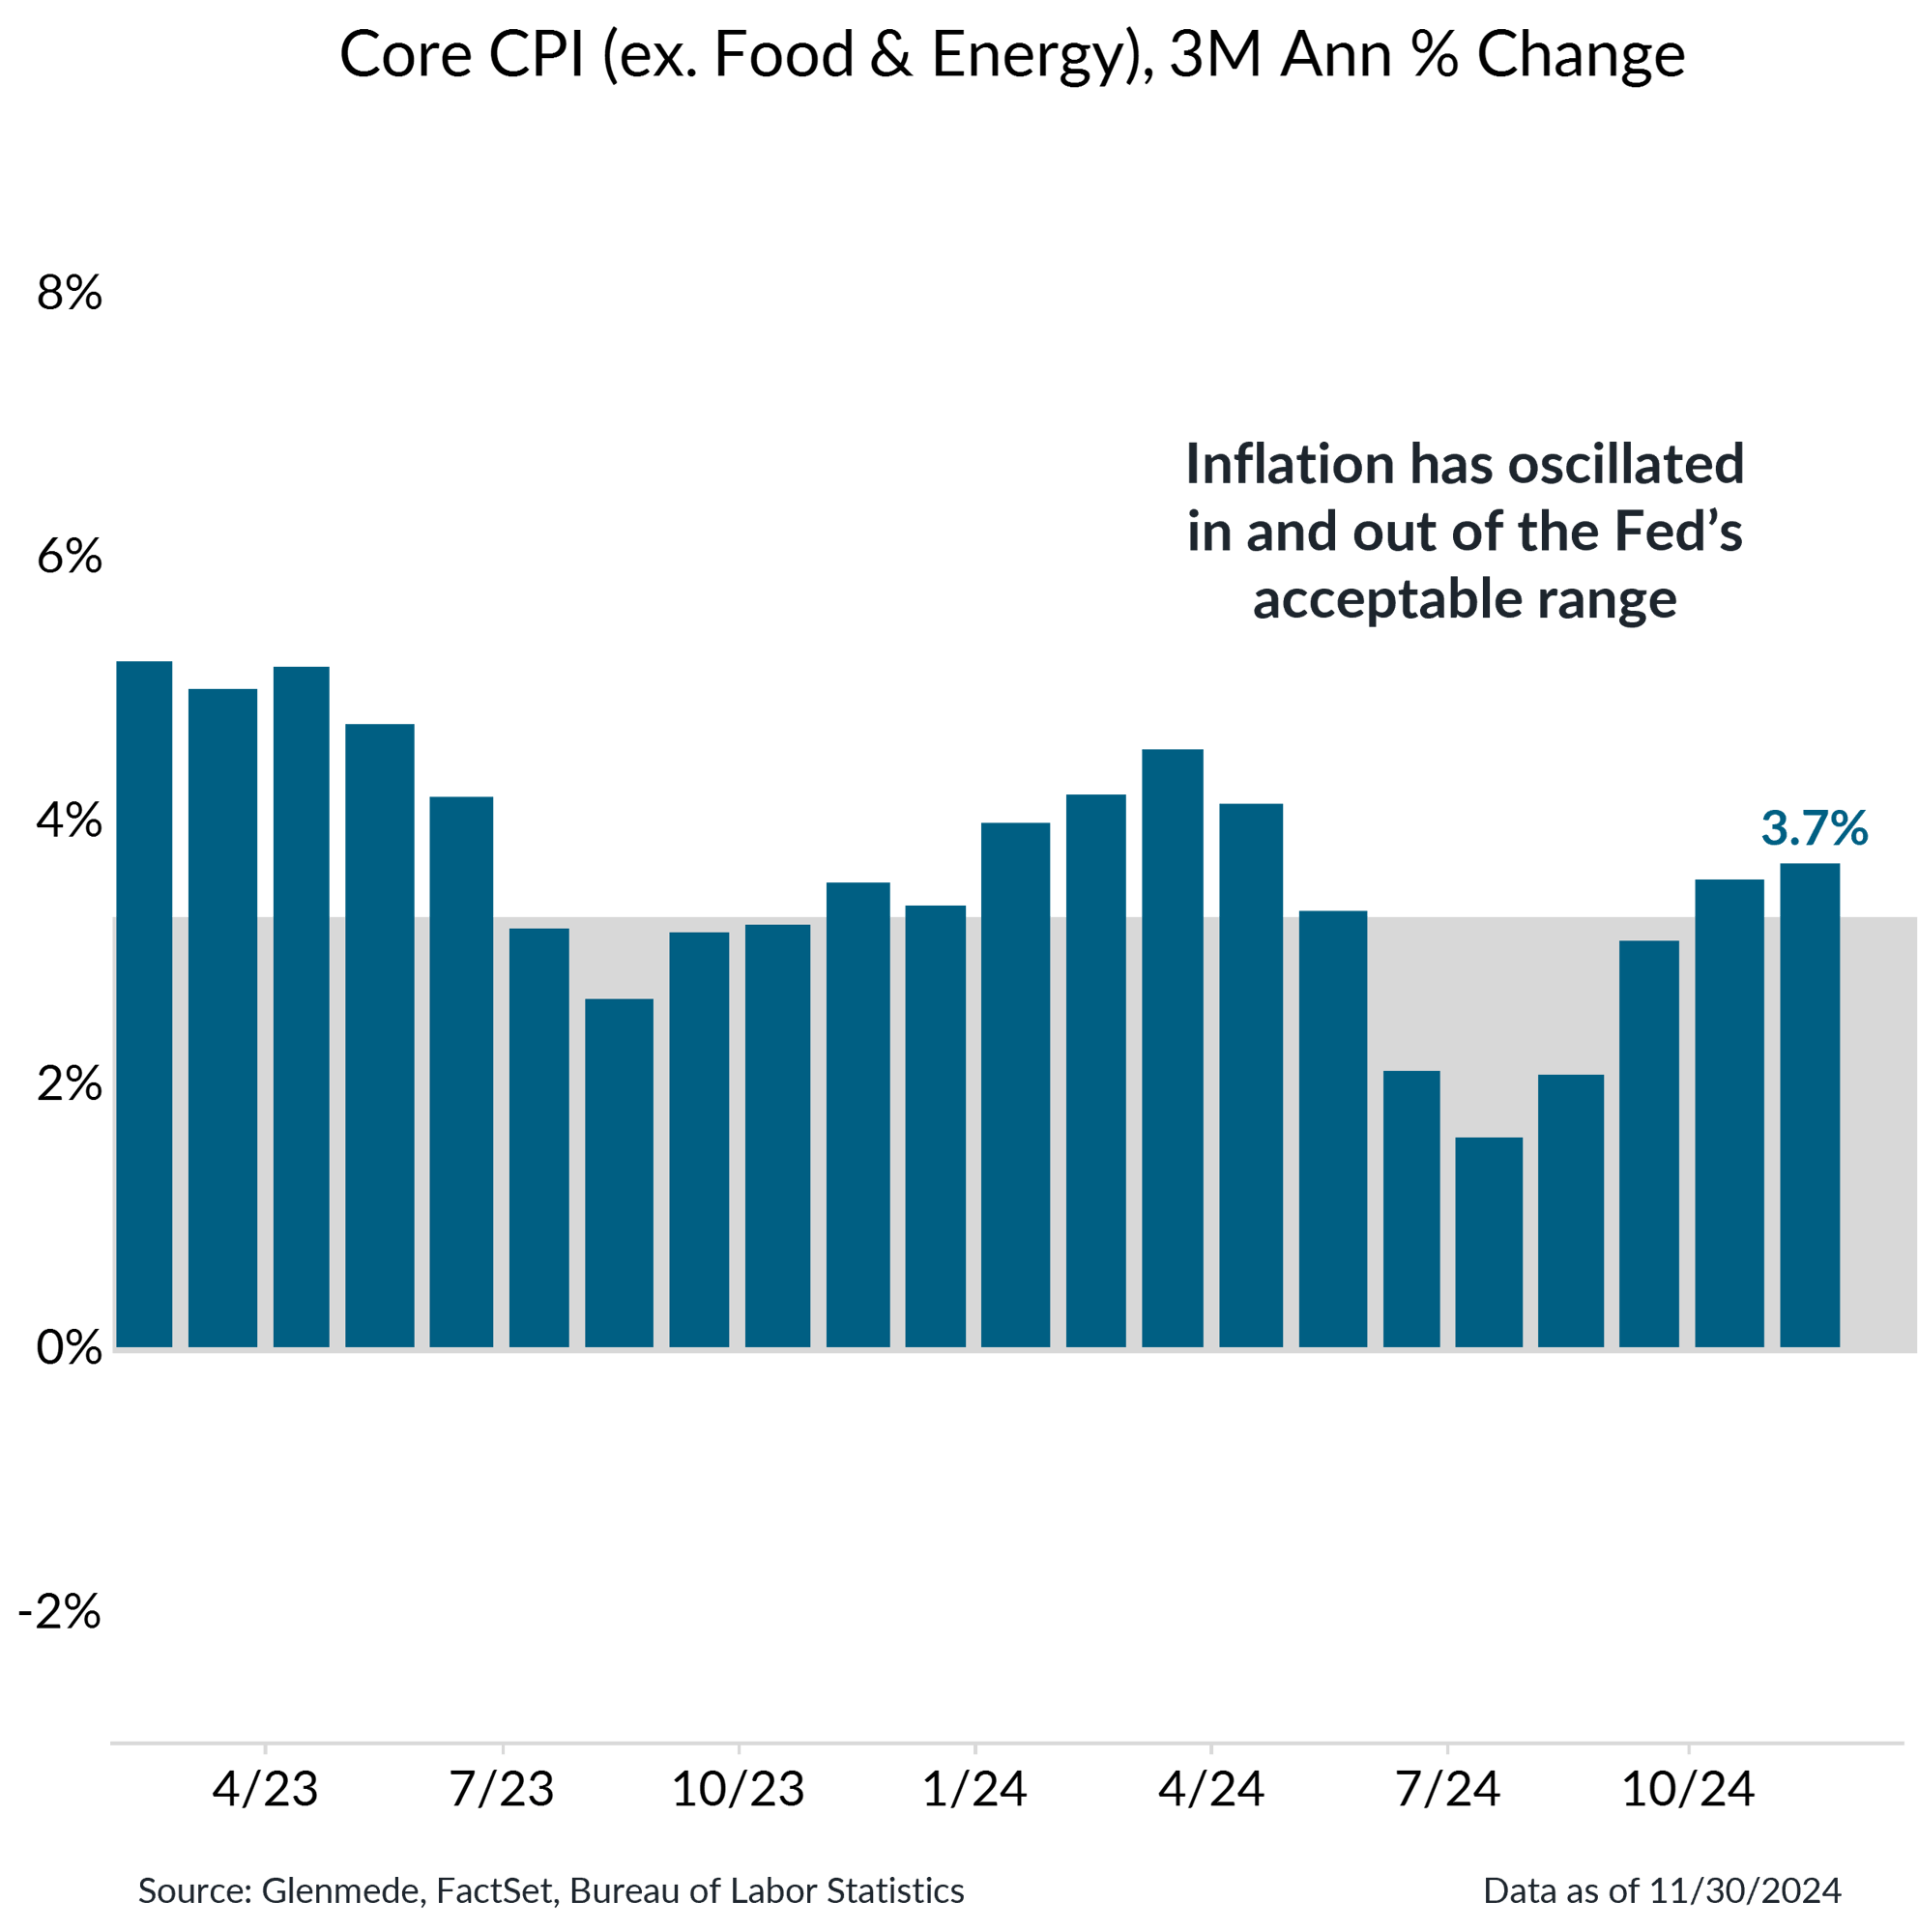
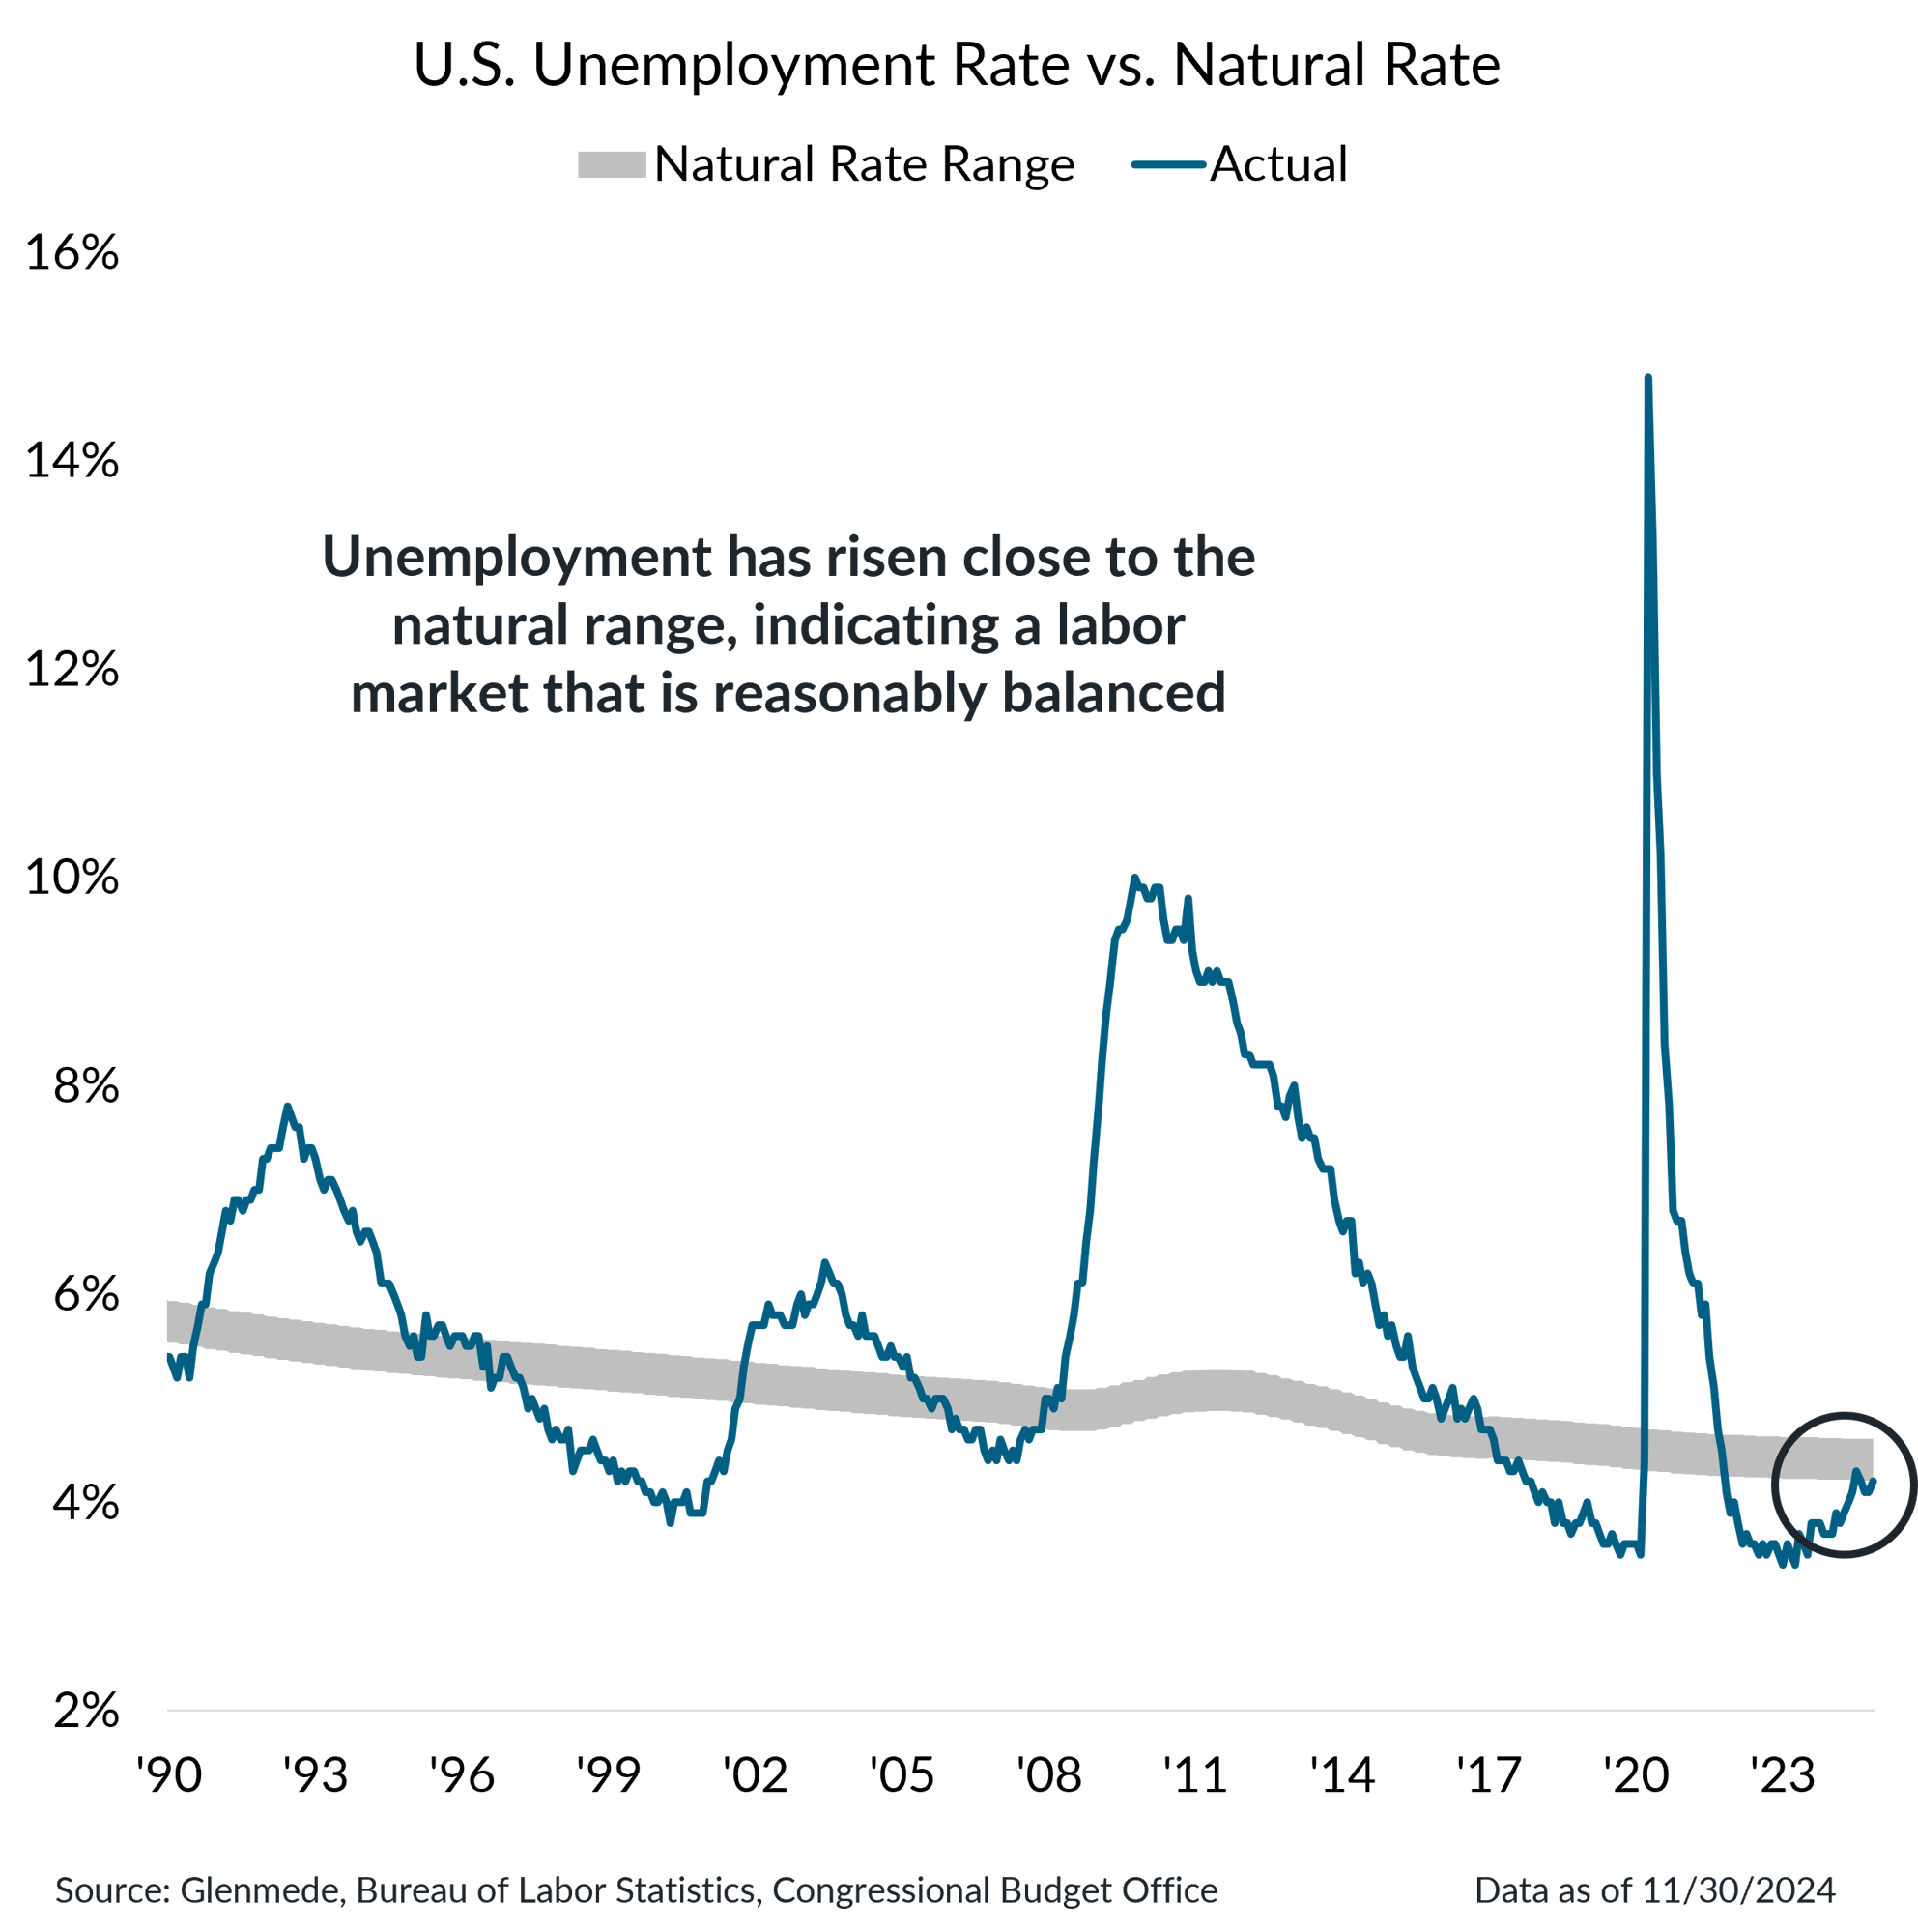
Shown in the left panel is the 3-month annualized percent change in the U.S. Consumer Price Index excluding food and energy. The gray region represents the Fed’s target range consistent with its price stability objective. Shown in the right panel is the U.S. unemployment rate for persons aged 16 years and over in blue and a range estimate provided by Congressional Budget Office (CBO) with a Glenmede defined buffer of the natural rate of unemployment in gray, which is the baseline level of joblessness that persists in a well-functioning economy due to frictional and structural factors.
- Last week's inflation data, along with other recent reports, show inflation continues to hover around acceptable levels, allowing the Fed to continue cutting rates.
- There is a fine line between normalization and deterioration in the labor market, but the U.S. appears to be on the path to normal as figures sit in the range consistent with the natural rate of unemployment.
The Fed has started cutting rates, but expect it to slow-walk further cuts as it feels its way to a neutral setting
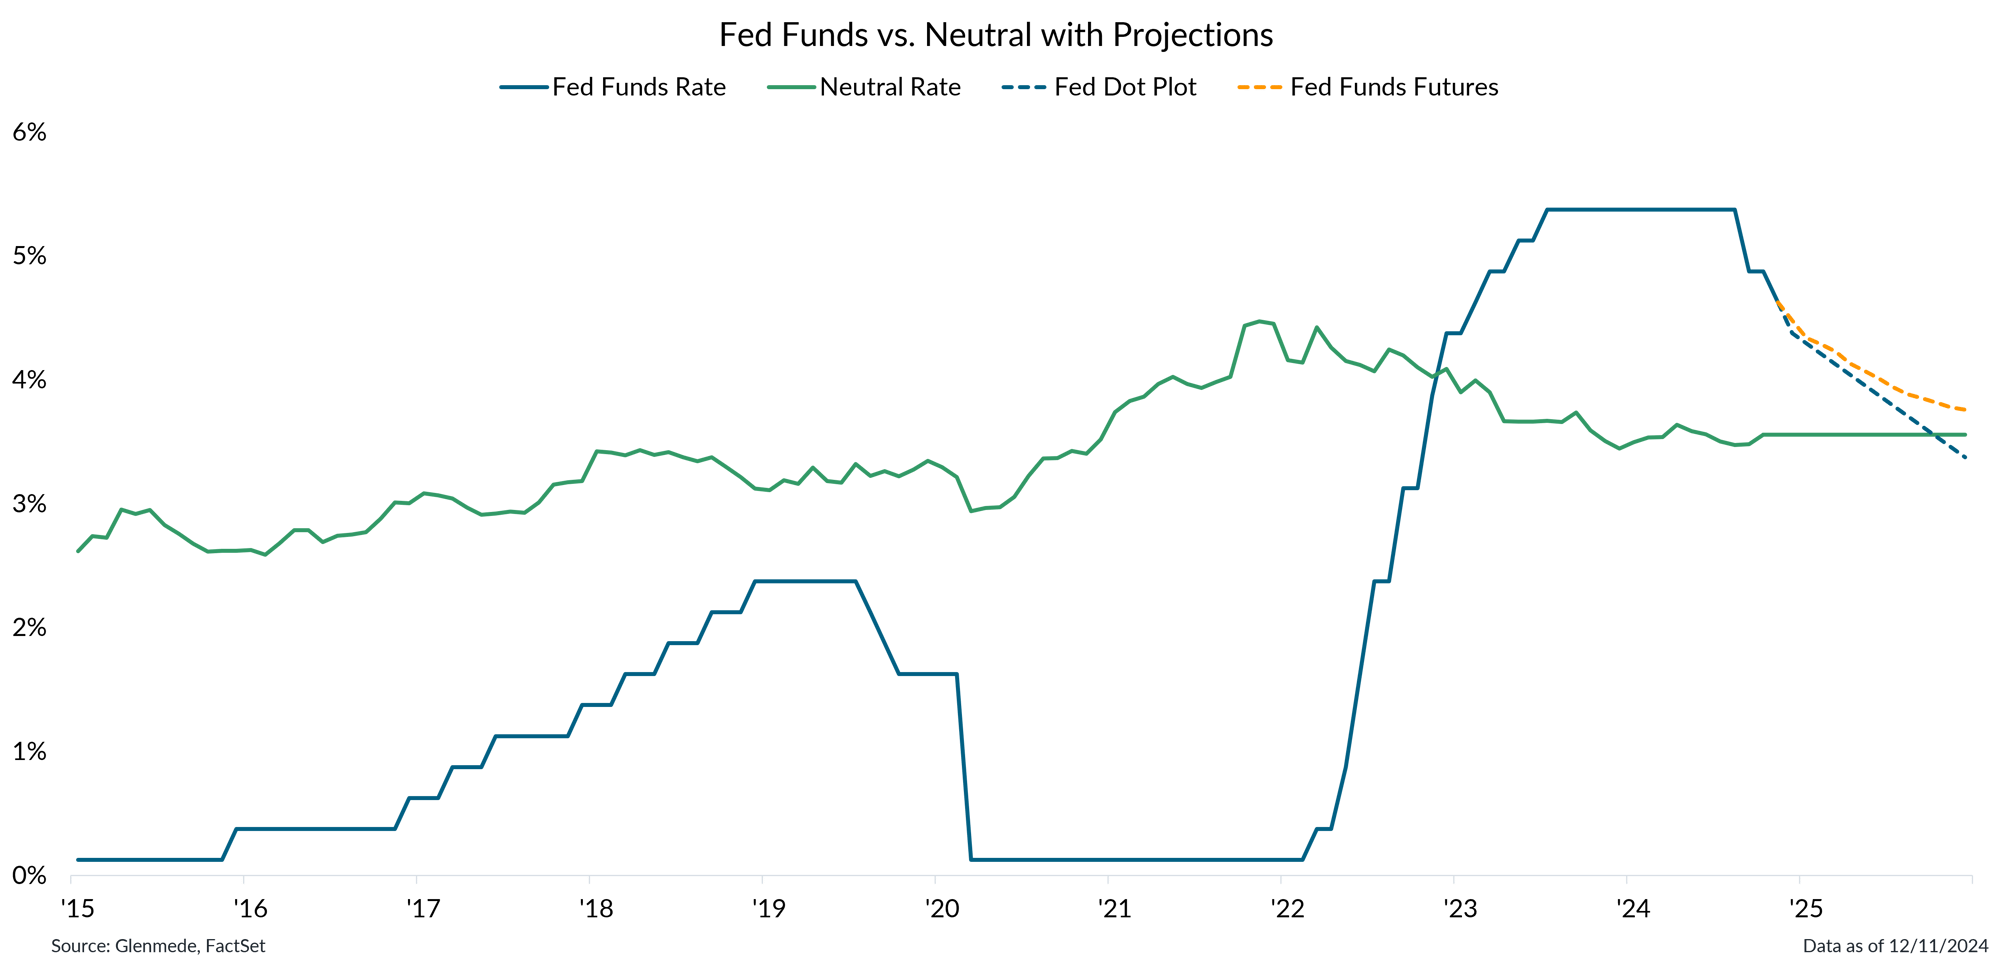
Data shown in green are Glenmede’s estimates of the neutral federal funds rate over time (i.e., the level of rates that is neither economically stimulative nor restrictive) based on expectations for real interest rates via the Holston-Laubach-Williams model and Glenmede’s 10yr inflation expectations. Fed Funds Rate in blue is the target rate midpoint. The dashed blue line represents projections based on the median response in the Federal Open Market Committee’s latest dot plot survey. The dashed yellow line represents projections based on fed funds futures, as of the latest date. Actual results may differ materially from projections.
- The Federal Reserve is expected to cut rates by another quarter-point this week, following more balanced labor market conditions and inflation trends.
- The new year is expected to usher in a more cautious and measured approach from the Fed, resulting in a slower path of rate cuts as they assess the state of the economy.
This material is intended to review matters of possible interest to Glenmede Trust Company clients and friends and is not intended as personalized investment advice. When provided to a client, advice is based on the client’s unique circumstances and may differ substantially from any general recommendations, suggestions or other considerations included in this material. Any opinions, recommendations, expectations or projections herein are based on information available at the time of publication and may change thereafter. Information obtained from third-party sources is assumed to be reliable but may not be independently verified, and the accuracy thereof is not guaranteed. Outcomes (including performance) may differ materially from any expectations and projections noted herein due to various risks and uncertainties. Any reference to risk management or risk control does not imply that risk can be eliminated. All investments have risk. Clients are encouraged to discuss any matter discussed herein with their Glenmede representative.

Feature one
Use text and images to tell your company’s story. Explain what makes your product or service extraordinary.

Feature two
Use text and images to tell your company’s story. Explain what makes your product or service extraordinary.

Feature three
Use text and images to tell your company’s story. Explain what makes your product or service extraordinary.

