Investment Strategy Brief
Q2 2024
Market Review
July 1, 2024

Executive Summary
- International emerging and domestic large cap equities were among the strongest performers of the quarter, whereas small caps and real estate trailed.
- The domestic economy continues to hurdle pessimistic projections, far outpacing consensus expectations over the preceding year.
- The U.S. remains in the late stage of its economic cycle, which has historically been characterized by more muted returns and greater recession risk.
- The economic outlook has become more balanced, but lingering risks and attractive bond yields warrant modestly defensive investment positioning.
International emerging and domestic large cap led the way, small caps and real estate trailed
.png?width=2000&height=1001&name=IS%20Brief%20Chart%201%202024-07-01%20(1).png)
Shown are cumulative total returns for various asset classes in Q2 2024 represented by the following indices: U.S. Large Cap (S&P 500), U.S. Small Cap (Russell 2000), Int’l Developed (MSCI EAFE), Int’l Emerging (MSCI EM), Real Estate (FTSE EPRA/NAREIT Developed), Core Bonds (Bloomberg U.S. Aggregate), Municipal Bonds (Bloomberg Municipal), High Yield (Corp) (Bloomberg U.S. High Yield (Ba to B)), High Yield (Muni) (Bloomberg Municipal High Yield), Cash (FTSE 3-Month Treasury Bills). Past performance may not be indicative of future results. One cannot invest directly in an index.
- The domestic equity bull market continues to be driven by outsized contributions from mega caps and large cap growth.
- Some of the more interest rate sensitive corners of the market for risk assets, such as real estate and small caps, proved sensitive to ebbing expectations for rate cuts this year.
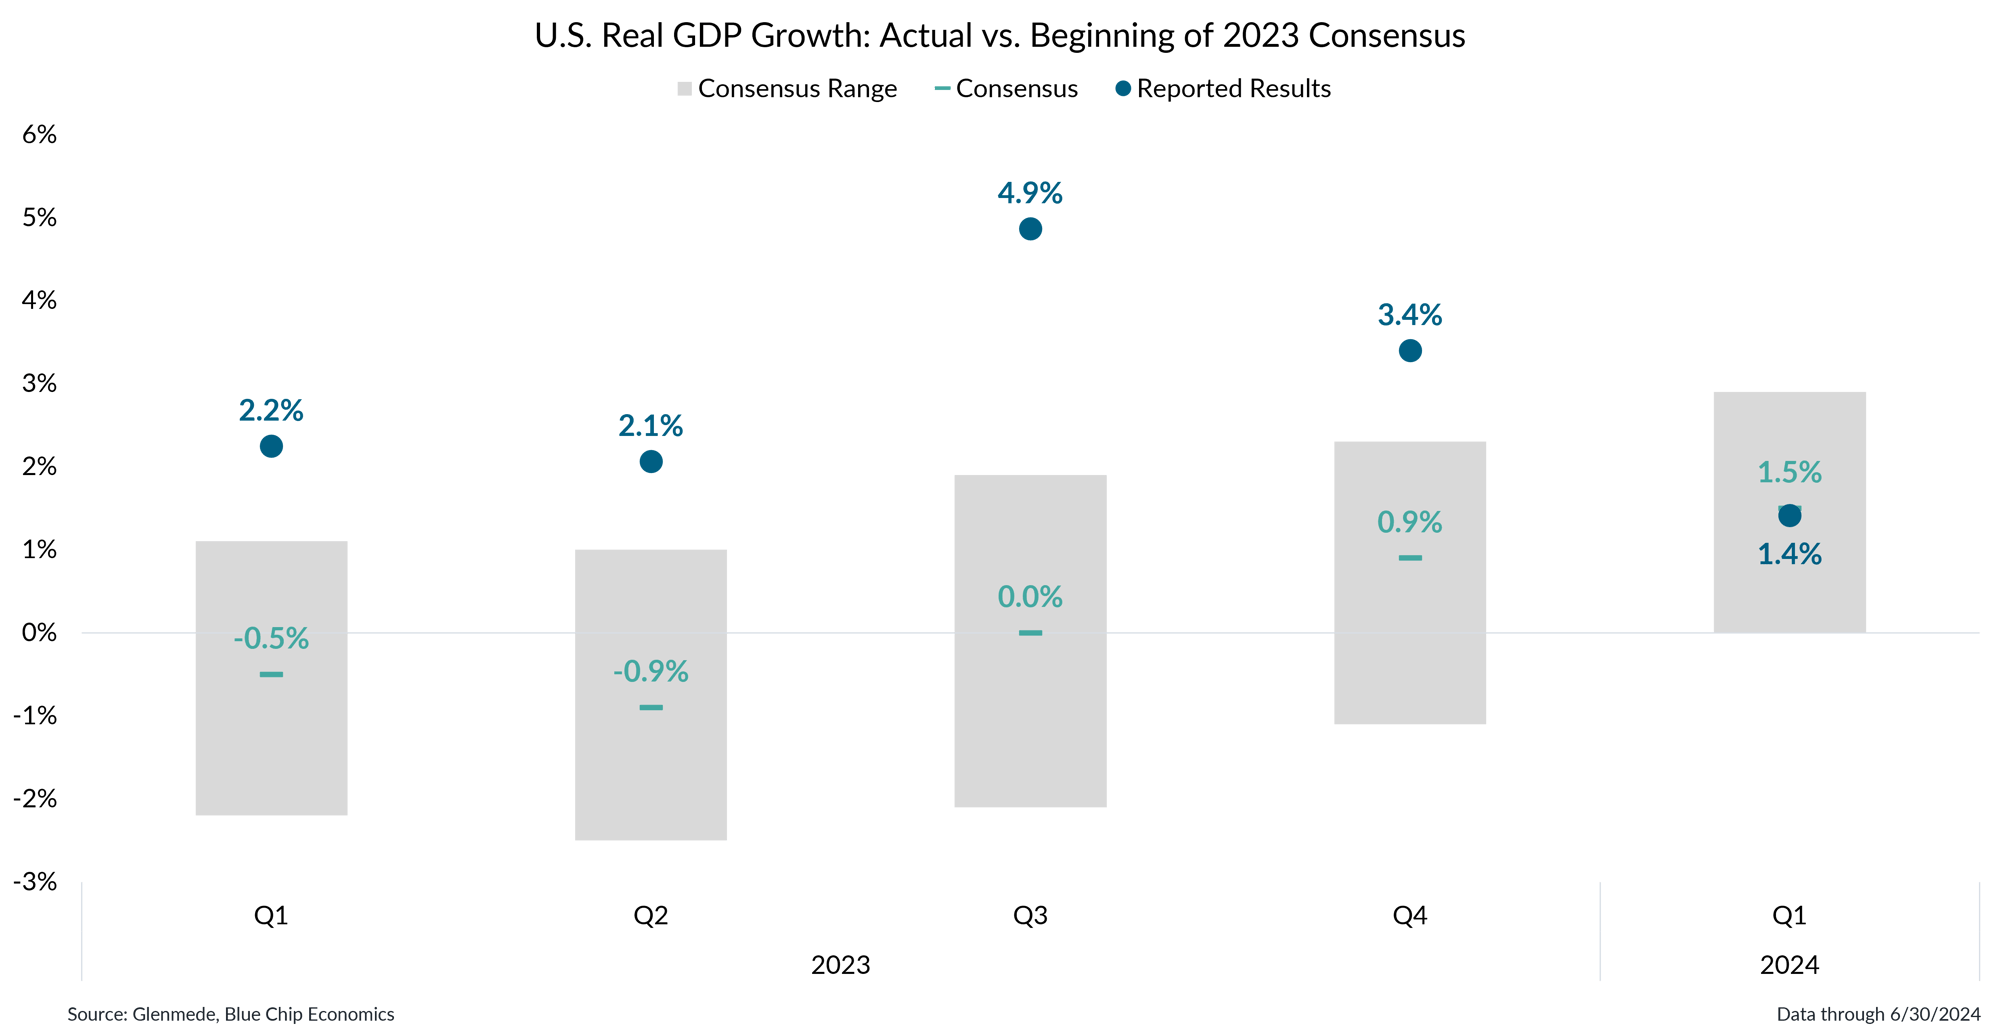
The economy continues to hum along after hurdling pessimistic projections

Data shown is real GDP growth on a quarter-over-quarter annualized basis. Reported data is shown by the blue dots and the range and consensus average of estimates from economists are shown by the gray bars and green lines, respectively. Consensus figures are derived from Blue Chip Economics via their January 2023 release.
- Consensus at the beginning of 2023 called for lackluster economic growth, but actual results have reported meaningfully above even some of the most optimistic projections.
- Some of the factors contributing to that resiliency have been stimulative fiscal policy, an economy with lower rate sensitivity and a consumer buoyed by pandemic-era savings/wealth effect tailwinds.
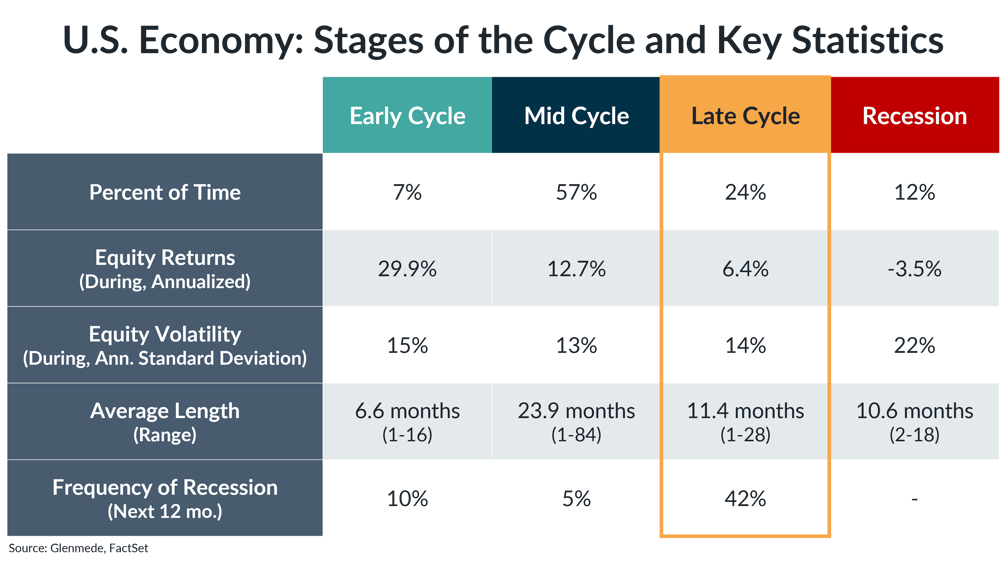
The U.S. economy remains in late cycle, characterized by more muted returns and greater recession risk

The table shown represents the frequency with which the U.S. economy sits in the various stages of economic expansion/recession since 1962, based on a Glenmede analysis of typical economic behavior from a handful of leading and excess indicators. Recession refers to periods of economic downturn, Early Cycle refers to rebounds from recessions, Mid Cycle refers to ongoing growth up to the economy’s potential and Late Cycle refers to periods where the economy is operating at or above potential. All references to equity returns refer to performance of the S&P 500 Index. The S&P 500 is a market capitalization weighted index of large cap stocks in the U.S. Past performance may not be indicative of future results. One cannot invest directly in an index.
- The U.S. economy is likely to remain in late cycle, which is typically an environment in which investors should actively monitor risks that could tip the U.S. toward recession.
- On average, late cycle expansions are typically categorized by mid-single-digit equity returns, suggesting investors should temper their expectations going forward.
This material is intended to review matters of possible interest to Glenmede Trust Company clients and friends and is not intended as personalized investment advice. When provided to a client, advice is based on the client’s unique circumstances and may differ substantially from any general recommendations, suggestions or other considerations included in this material. Any opinions, recommendations, expectations or projections herein are based on information available at the time of publication and may change thereafter. Information obtained from third-party sources is assumed to be reliable but may not be independently verified, and the accuracy thereof is not guaranteed. Outcomes (including performance) may differ materially from any expectations and projections noted herein due to various risks and uncertainties. Any reference to risk management or risk control does not imply that risk can be eliminated. All investments have risk. Clients are encouraged to discuss any matter discussed herein with their Glenmede representative.

Feature one
Use text and images to tell your company’s story. Explain what makes your product or service extraordinary.

Feature two
Use text and images to tell your company’s story. Explain what makes your product or service extraordinary.

Feature three
Use text and images to tell your company’s story. Explain what makes your product or service extraordinary.

