

Investment Strategy Brief | July 5, 2026
Q2 2026 Market Review

Executive Summary
-
Equity markets rebounded sharply in Q2, while bonds remained volatile with major asset classes posting strong gains.
-
SpaceX completed the largest initial public offering (IPO) on record, with other high-profile IPOs expected to follow.
-
Oil prices retreated following the U.S.-Iran deal, with traffic through the Strait of Hormuz a key indicator to watch.
-
Fed funds expectations tilted hawkish in Q2, while Chair Kevin Warsh announced five task forces aimed at reform.
-
The economic growth outlook remains constructive, with several key developments poised to shape the remainder of the year.
Equities staged a recovery in Q2, while bonds remained volatile
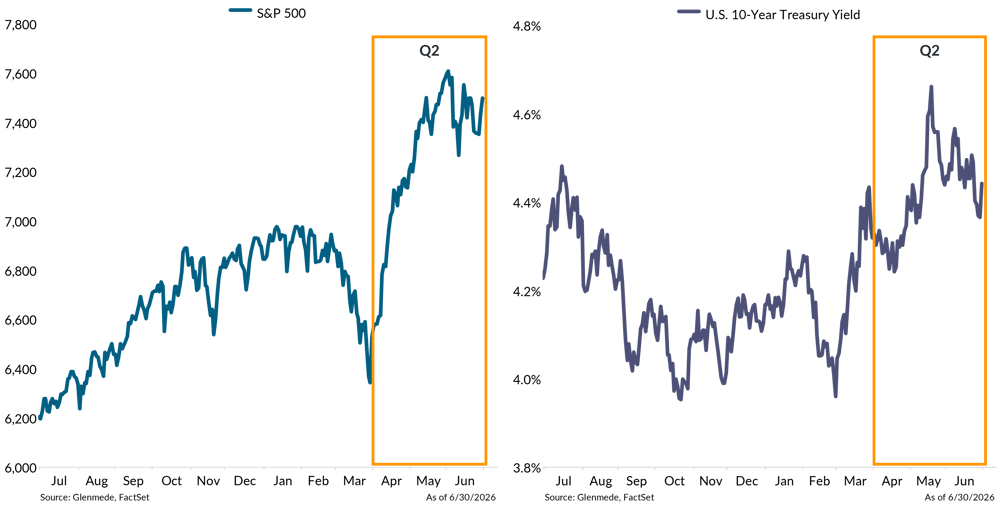
Shown on the left is the S&P 500, which is a market capitalization weighted index of U.S. large cap stocks. Shown on the right is the yield on 10-year U.S. Treasury bonds. Past performance may not be indicative of future results. One cannot invest directly in an index.
-
After a sharp pullback in March, the S&P 500 rebounded strongly through Q2, reaching new all-time highs before partially retracing in June amid renewed concerns surrounding investments in AI.
-
The 10-year Treasury yield oscillated throughout the quarter, rising toward 4.7% amid continued uncertainty around inflation and the path of monetary policy before easing late in the quarter.
Major asset classes posted strong gains in Q2, recovering from the geopolitical-driven drawdown in Q1
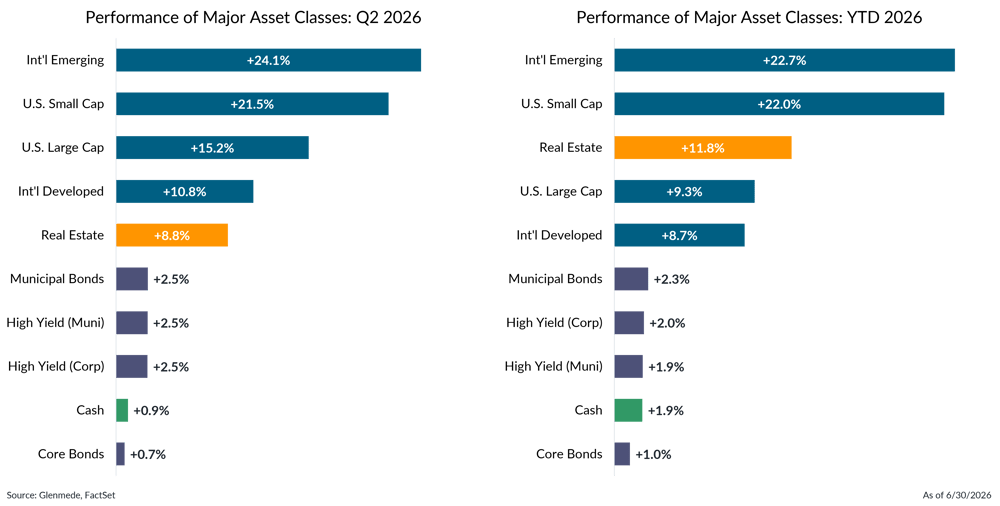
Shown are second-quarter and year-to-date 2026 total returns for various asset classes represented by the following indices: U.S. Large Cap (S&P 500), U.S. Small Cap (Russell 2000), Int’l Developed (MSCI EAFE), Int’l Emerging (MSCI EM), Real Estate (FTSE EPRA/NAREIT Developed), Core Bonds (Bloomberg U.S. Aggregate), Municipal Bonds (Bloomberg Municipal), High Yield (Corp) (Bloomberg U.S. High Yield Ba to B), High Yield (Muni) (Bloomberg Municipal High Yield), Cash (FTSE 3-Month Treasury Bills). Past performance may not be indicative of future results. One cannot invest directly in an index..
-
Most major asset classes delivered positive returns in Q2, with emerging markets and small cap equities leading the way, each advancing more than 20% for the quarter.
-
Small caps notably outpaced large caps by roughly 6%, extending their year-to-date outperformance to nearly 13%.
SpaceX's IPO set records for valuation and size, with Anthropic and OpenAI expected to follow
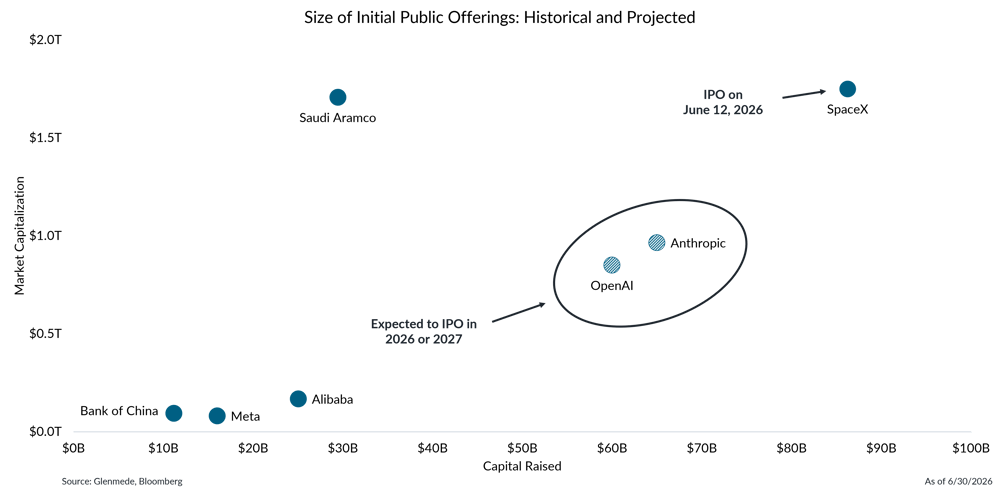
Shown are the sizes of select historical and anticipated initial public offerings (IPOs), measured by market capitalization and total capital raised. Figures for Anthropic and OpenAI are estimates based on publicly reported expected valuations and projected offering sizes. The projections are illustrative and subject to uncertainty, as actual IPO valuations, offering sizes, and timing may differ materially from expectations. Historical IPOs are shown for comparison purposes only and are not indicative of future results. Actual results may differ materially from expectations. References to individual securities should not be construed as a recommendation to buy, hold, or sell.
-
In June, SpaceX completed the largest IPO on record, raising approximately $75 billion at valuation of roughly $1.75 trillion.
-
Anthropic and OpenAI are both anticipated to follow later this year or 2027, underscoring how a handful of large, high-profile deals are increasingly driving overall IPO issuance.
Traffic through the Strait of Hormuz is a key indicator to watch in Q3, as oil prices retreated following the U.S.-Iran deal
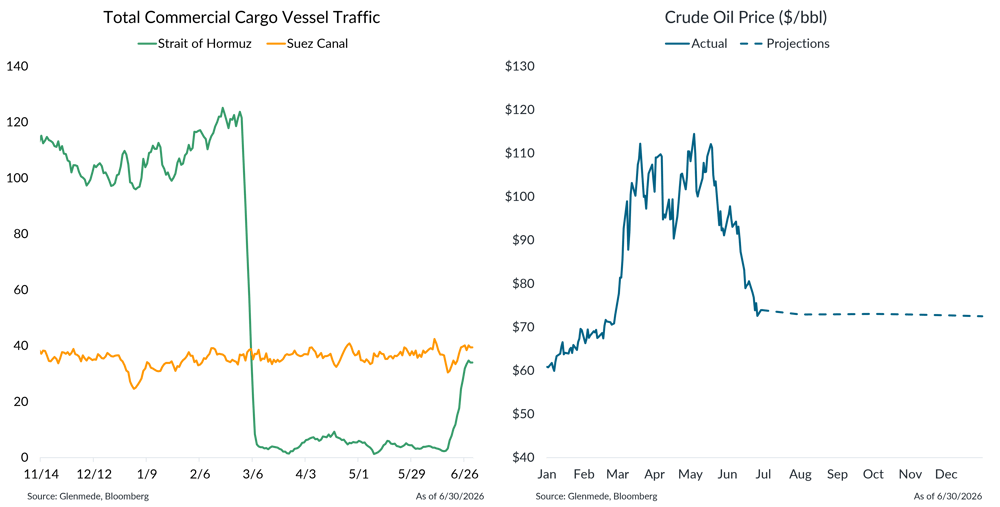
Shown on the left is the seven-day average of daily bidirectional commercial cargo vessel flows across the Strait of Hormuz and the Suez Canal. Shown on the right are the spot prices of Brent crude oil over time, measured in U.S. dollars per barrel. The dotted line represents the average market-implied Brent crude oil price based on futures contracts. Futures contracts reflect current market expectations for future oil prices and are not guaranteed forecasts of future spot prices. Actual results may differ materially from projections.
-
The U.S. and Iran reached an agreement that allowed commercial traffic to resume through the Strait of Hormuz, a critical transit route for energy commodities.
-
Vessel traffic through Hormuz began to recover late in the quarter but remained well below preconflict levels, making a fuller recovery a key indicator for oil prices and energy-related inflation heading into Q3.
-
Oil prices, which had spiked amid the escalation of conflict in Iran, retreated as tensions deescalated and the agreement was reached, with projections pointing to further normalization into 2027.
Fed funds expectations tilted hawkish in Q2, while Chair Warsh announced five task forces aimed at reform
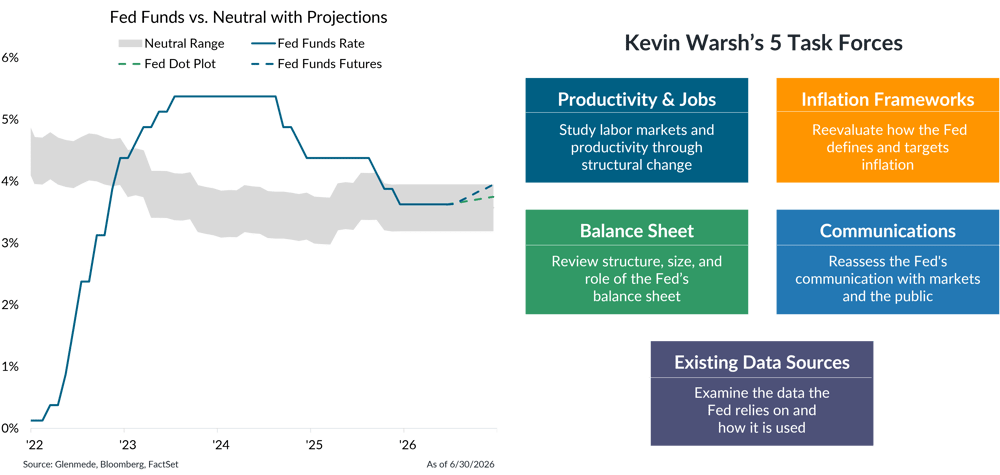
Shown on the left in gray are Glenmede’s range estimates of the neutral federal funds rate over time (i.e., the level of rates that is neither economically stimulative nor restrictive) based on expectations for real interest rates via the Holston-Laubach-Williams model and Glenmede’s inflation expectations. Fed Funds Rate in blue is the target rate midpoint. The dashed blue line represents expectations for the forward path of rates based on fed funds futures pricing. The dashed green line represents expectations for the forward path of rates based on the median respondent in the Federal Open Market Committee’s dot plot projections. Projections and expectations are arrived at in good faith, but actual results may differ materially. Shown on the right is a nonexhaustive overview of expected key areas of focus for Kevin Warsh as Fed Chair.
-
Fed funds expectations turned more hawkish in Q2, with markets and the Fed’s dot plot pointing to possible 2026 rate hikes, contingent on energy-driven inflation broadening across the consumer basket.
-
Warsh announced five task forces covering Fed communications, the balance sheet, data usage, productivity and jobs, and inflation frameworks.
-
The broad scope of the review signals an active reset of the Fed’s policy framework, across communications, data usage, and inflation targeting, with meaningful changes likely under Warsh’s tenure.
Expectations for economic growth remain strong, with several key items to watch
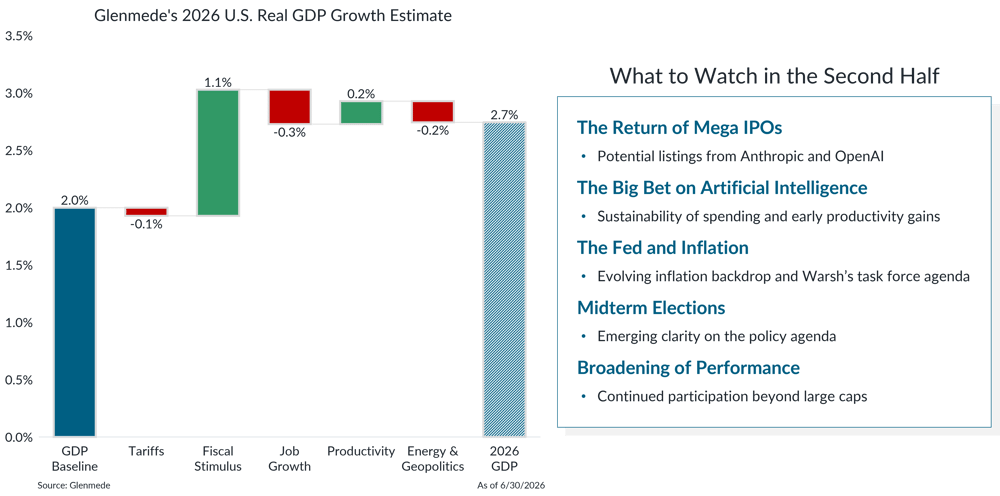
Shown on the left are the drivers of and their estimated impact on U.S. real gross domestic product (GDP) growth. GDP Baseline is an assumed long-term growth rate for the U.S. economy that is consistent with estimates used by both the Congressional Budget Office (CBO) and the Federal Reserve. Shown on the right is a brief breakdown of major expected economic drivers in 2026. Though created in good faith, there can be no guarantee that these projections will be accurate. Actual results may differ materially from projections.
-
U.S. real GDP growth expectations for 2026 remain solid at 2.7%, with fiscal stimulus and early AI-driven productivity gains helping to offset headwinds from tariffs, higher energy prices, and a softening labor market.
-
Several catalysts will likely shape the second-half outlook, including potential listings from Anthropic and OpenAI, the sustainability of AI-driven capex, and how the Fed navigates inflation under Chair Warsh's task force agenda.
-
Also in focus are emerging clarity on the midterm policy agenda and whether market performance continues to broaden beyond large caps.
-
Overall, the economic growth outlook remains constructive, with several key developments poised to shape the remainder of the year.
For more in-depth information on this topic, please reach out to your Glenmede Relationship Manager.

This material is provided solely for informational and/or educational purposes and is not intended as personalized investment advice. When provided to a client, advice is based on the client’s unique circumstances and may differ substantially from any general recommendations, suggestions or other considerations included in this material. Any opinions, recommendations, expectations or projections herein are based on information available at the time of publication and may change thereafter. Information obtained from third-party sources is assumed to be reliable but may not be independently verified, and the accuracy thereof is not guaranteed. Any company, fund or security referenced herein is provided solely for illustrative purposes and should not be construed as a recommendation to buy, hold or sell it. Outcomes (including performance) may differ materially from any expectations and projections noted herein due to various risks and uncertainties. Any reference to risk management or risk control does not imply that risk can be eliminated. All investments have risk. Clients are encouraged to discuss any matter discussed herein with their Glenmede representative.