

Investment Strategy Brief | July 19, 2026
Q2 Earnings: No Signs of Slowing

Executive Summary
-
Earnings season is ramping up with early results pointing to continued strong profitability in 2026.
-
Expectations for both Q2 and 2026 earnings growth have strengthened notably throughout the year.
-
Substantial earnings growth is no longer just a story about the Magnificent 7.
-
Compared to past periods of market enthusiasm, earnings have kept pace with the current rally.
-
Earnings are currently expected to remain relatively resilient, which may provide support for equity markets.
Q2 earnings season is ramping up with early results pointing to continued strong profitability in 2026
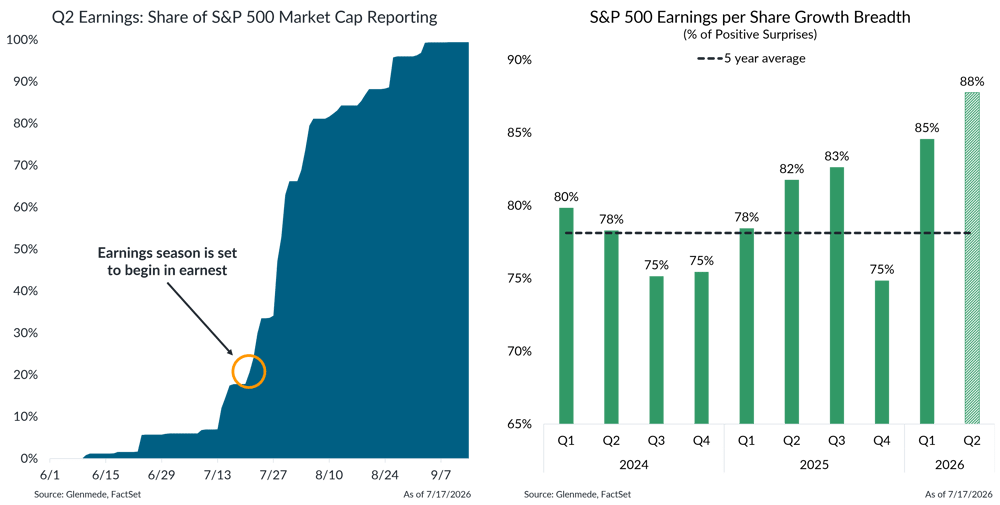
Shown on the left is a timeline of the cumulative share of the S&P 500’s market capitalization that has reported or will report Q2 2026 earnings results. Shown on the right is the percentage of companies within the S&P 500 that have reported earnings to date ahead of consensus expectations. The dashed line reflects the 5-year average percentage of companies reporting positive earnings surprises, and the hashed bar represents results reported to date for Q2 2026. Past performance may not be indicative of future results. One cannot invest directly in an index.
-
Earnings season kicked off with several major banks reporting last week and the bulk of companies reporting over the next two weeks.
-
Early results suggest a strong Q2, with ~88% of companies beating expectations so far, a pace even higher than the previous quarter.
Earnings are expected to grow across most sectors, with energy and technology leading the way
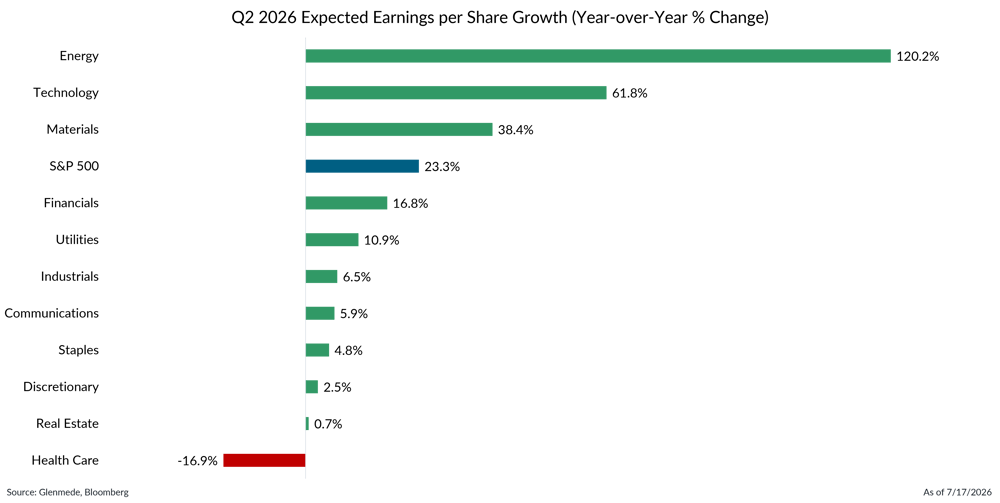
Shown are the blended year-over-year growth rates in earnings per share for the S&P 500 and its eleven constituent sectors for Q2 2026. Blended growth rates combine actual results with consensus expectations for companies that have yet to report. The S&P 500 is a market capitalization weighted index of large cap stocks in the U.S. Actual results may differ materially from expectations. One cannot invest directly in an index.
-
S&P 500 earnings growth is expected to exceed 20% in the second quarter, led by significant increases in earnings for the energy and technology sectors.
-
Higher commodity prices are providing a tailwind for the energy sector, while technology remains a key driver of overall index earnings growth.
-
Beyond the leaders, growth is projected to be broadly distributed across the market, with all sectors except health care expected to post positive results.
Expectations for both Q2 and 2026 earnings growth have strengthened notably throughout the year
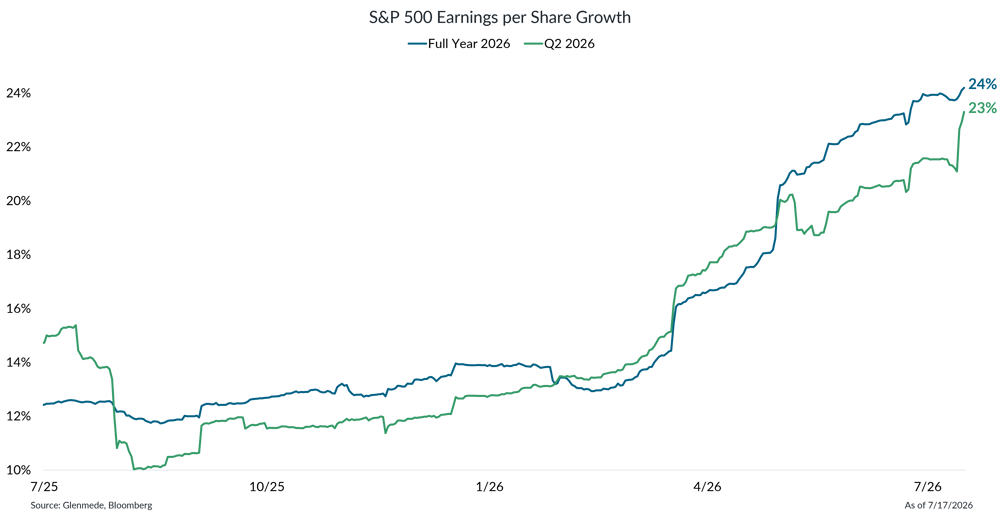
Shown is the progression of estimates for year-over-year growth in S&P 500 earnings per share for full year 2026 in blue and for Q2 2026 in green. Estimates are based on consensus analyst expectations and are subject to change. Actual results may differ materially from expectations. One cannot invest directly in an index.
-
Expectations for both Q2 and full-year 2026 earnings growth have risen substantially throughout the year, from roughly 10% to nearly 24% growth.
-
Improvement in earnings growth of this magnitude reflects more than just resilience; it reflects a robust earnings cycle that analysts have consistently underestimated.
Strong earnings growth has come on the heels of significant fiscal policy
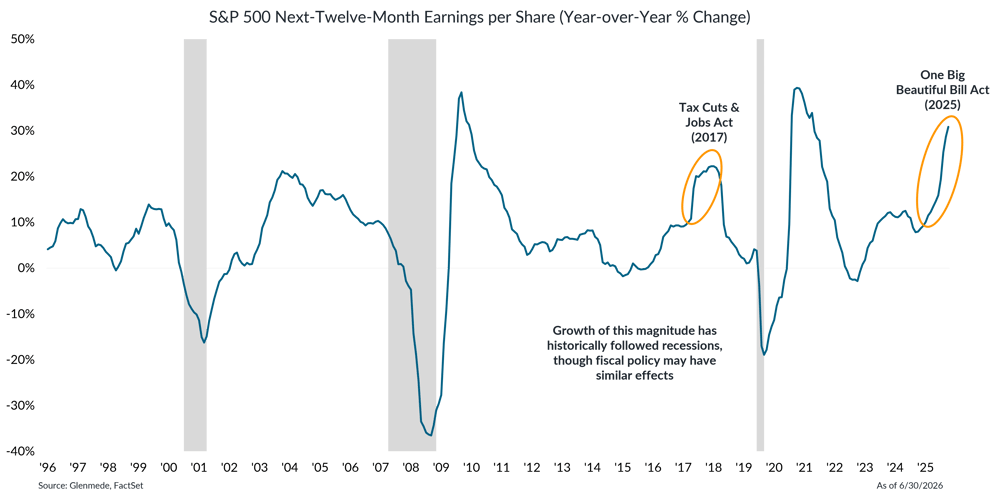
Shown is the year-over-year percent change in the S&P 500's next-twelve-month earnings per share estimate. Shaded regions represent U.S. recessions. Estimates are based on consensus analyst expectations and are subject to change. Actual results may differ materially from expectations. One cannot invest directly in an index.
-
Historically, the strongest earnings growth has occurred following recessions, when profits rebound from depressed levels amid improving economic conditions.
-
However, strong earnings growth has also followed major fiscal policy initiatives, such as the Tax Cuts and Jobs Act in 2017, after which earnings growth accelerated sharply.
-
A similar pattern is now emerging, with last year’s One Big Beautiful Bill Act acting as a fiscal tailwind for the overall economy and corporate profits.
Substantial earnings growth is no longer just a story about the Magnificent 7
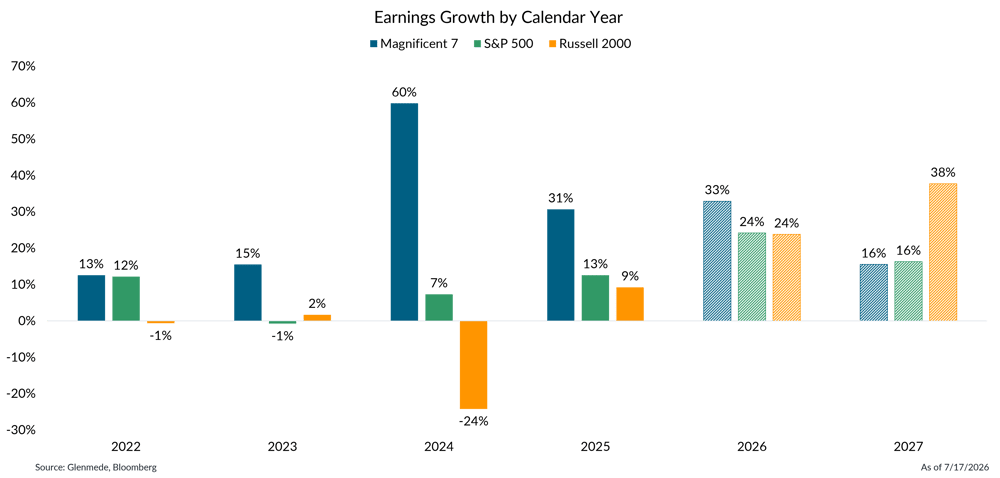
Shown are the annual calendar year growth rates in earnings for the Magnificent 7 (Apple, Microsoft, Alphabet, Amazon, Nvidia, Meta, Tesla) on an equal-weighted basis, the S&P 500, and the Russell 2000. Solid bars represent actual results, and hashed bars represent projections based on bottom-up equity analyst estimates. The S&P 500 is a market capitalization weighted index of large cap stocks in the U.S. The Russell 2000 is a market capitalization weighted index of small cap stocks in the U.S. This visual should not be interpreted as a recommendation to buy, hold, or sell any specific securities. Past performance may not be indicative of future results. Estimates are based on consensus analyst expectations and are subject to change. Actual results may differ materially from expectations. One cannot invest directly in an index
-
While earnings growth among the largest companies is expected to remain quite strong, other parts of the market are now expected to also deliver outsized growth.
-
Small cap is expected to outpace both large cap and the Magnificent 7 by 2027, a sign that profit expansion is spreading beyond the market's largest companies.
Compared to past periods of market enthusiasm, the current rally has been more closely tied to fundamentals
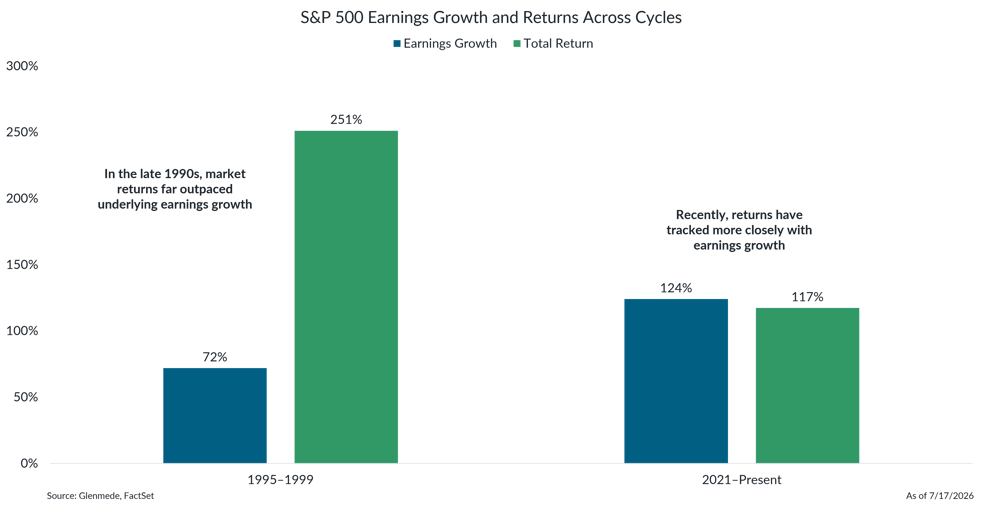
Shown are cumulative S&P 500 total returns and aggregate earnings per share growth over the periods indicated. Comparisons are provided for illustrative purposes only. Past performance may not be indicative of future results. One cannot invest directly in an index.
-
During the late-1990s technology boom, market returns significantly outpaced underlying earnings growth, expanding valuations to unsustainable levels.
-
The current cycle looks markedly different, with the market’s returns tracking much more closely with the underlying earnings growth, limiting the multiple expansion.
For more in-depth information on this topic, please reach out to your Glenmede Relationship Manager.

This material is provided solely for informational or educational purposes and is not intended as personalized investment advice. When provided to a client, advice is based on the client's unique circumstances and may differ substantially from any general recommendations, suggestions, or other considerations included in this material. Any opinions, recommendations, expectations, or projections included herein are subject to change, and any potential outcome discussed, including but not limited to performance, legislation, or tax consequence, ultimately may not occur. Information obtained from third-party sources is assumed to be reliable but may not be independently verified, and the accuracy thereof is not guaranteed. Any company, fund, or security referenced herein is provided solely for illustrative purposes and is not a recommendation to buy, hold, or sell it. Any reference to risk management or risk control does not imply that risk can be eliminated. All investments have risk. Readers should contact Glenmede or consult with a financial, investment, tax, legal, or other advisor if they have any questions about this material or want advice or more information.