Investment Strategy Brief
Q2 Earnings Wrap-Up
August 17, 2025

Executive Summary
- Q2 earnings season is wrapping up, with results showing resilience despite economic uncertainty.
- Pricing data suggest businesses may be absorbing most of the tariff costs, though this may not yet fully be reflected in margins.
- Companies are beginning to cite benefits from the One Big Beautiful Bill Act (OBBBA), which may soon help sterilize tariff impacts.
- While large caps continue to deliver strong earnings growth, small caps are poised for a comeback.
- Corporate earnings have demonstrated resilience, and prospects for broader earnings growth favor small caps.
Q2 earnings season is wrapping up, with results showing resilience despite economic uncertainty

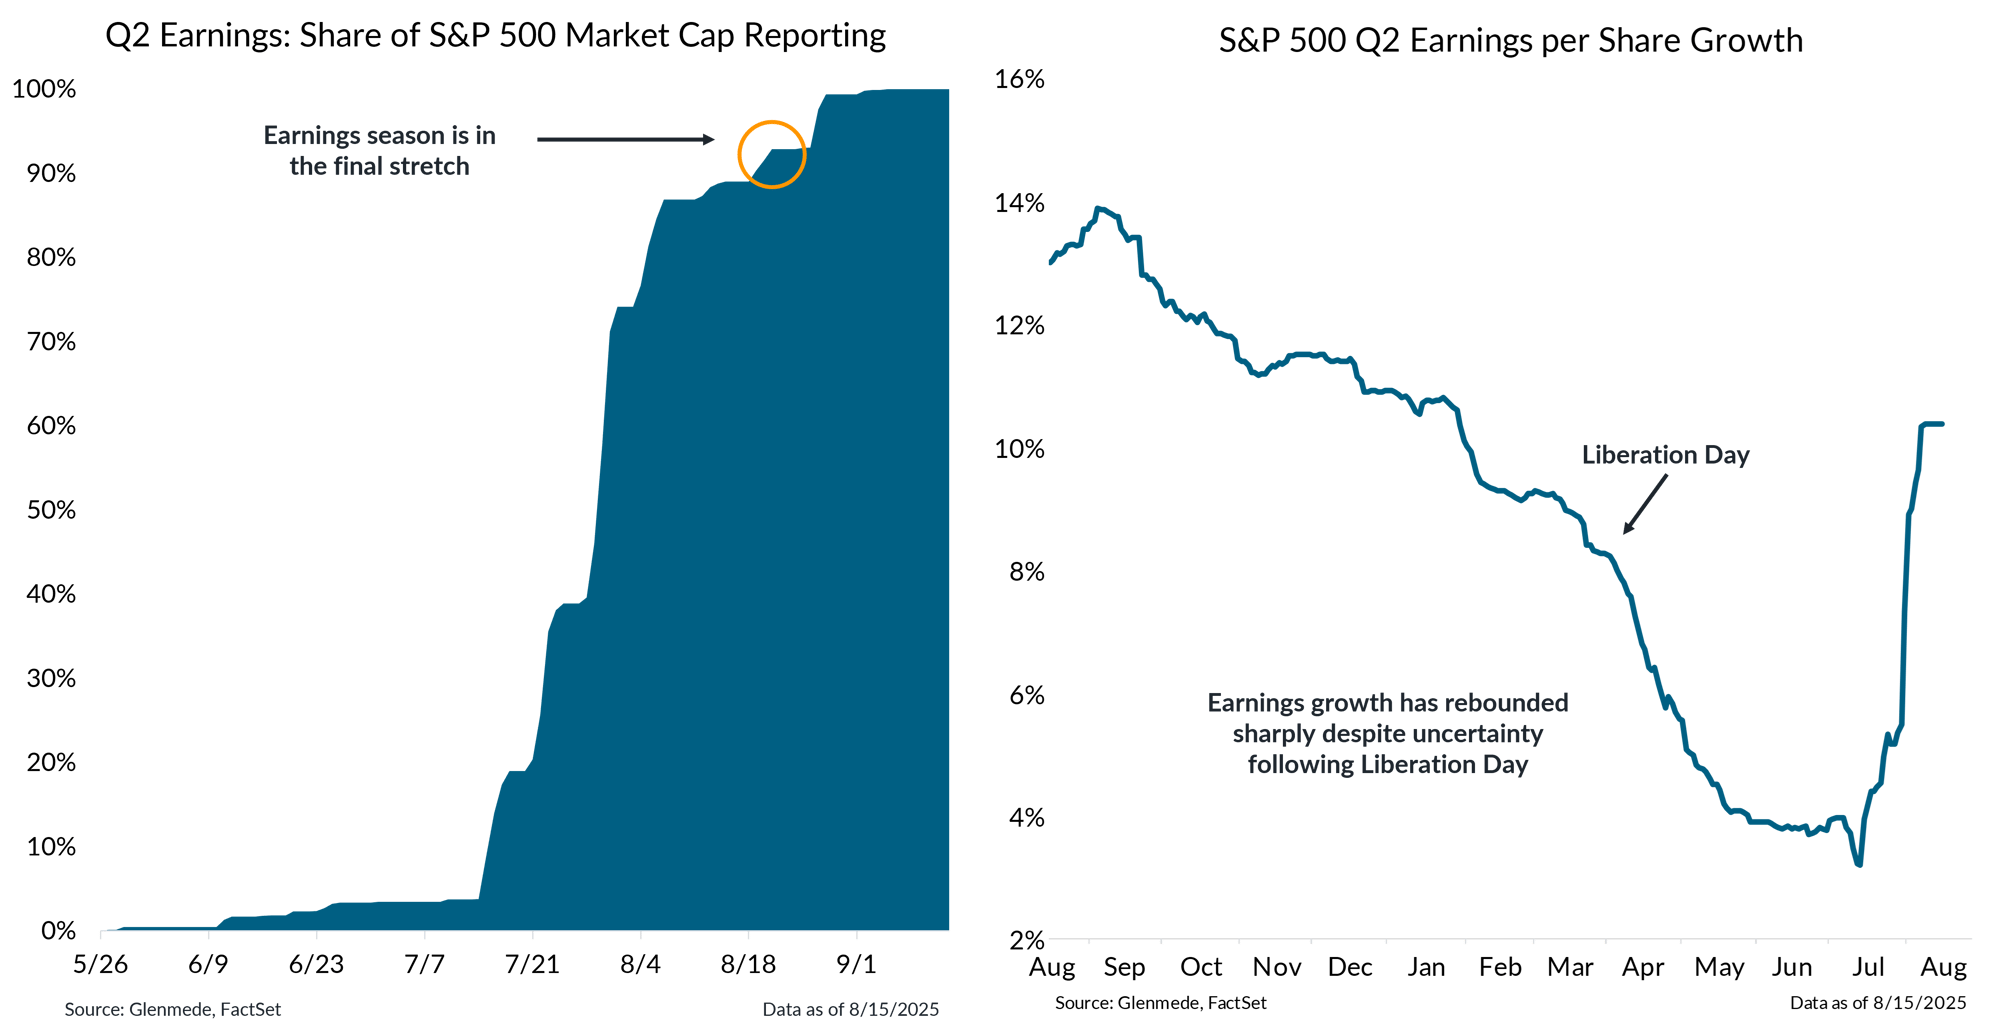
Shown in the left panel is a timeline of the cumulative share of the S&P 500’s market capitalization that have or will report Q2 2025 earnings results. Shown in the right panel is the progression of S&P 500 earnings per share estimates for Q2 2025 on a year-over-year change basis. Actual results may differ materially from expectations. One cannot invest directly in an index.
- Earnings season is winding down, with only about 10% of the S&P 500 by market capitalization yet to report.
- Q2 earnings growth is now expected to surpass pre-Liberation Day forecasts, a remarkable feat given the many changes to U.S. trade policy (and related uncertainty) since then.
Most sectors are outpacing initial estimates this earnings season

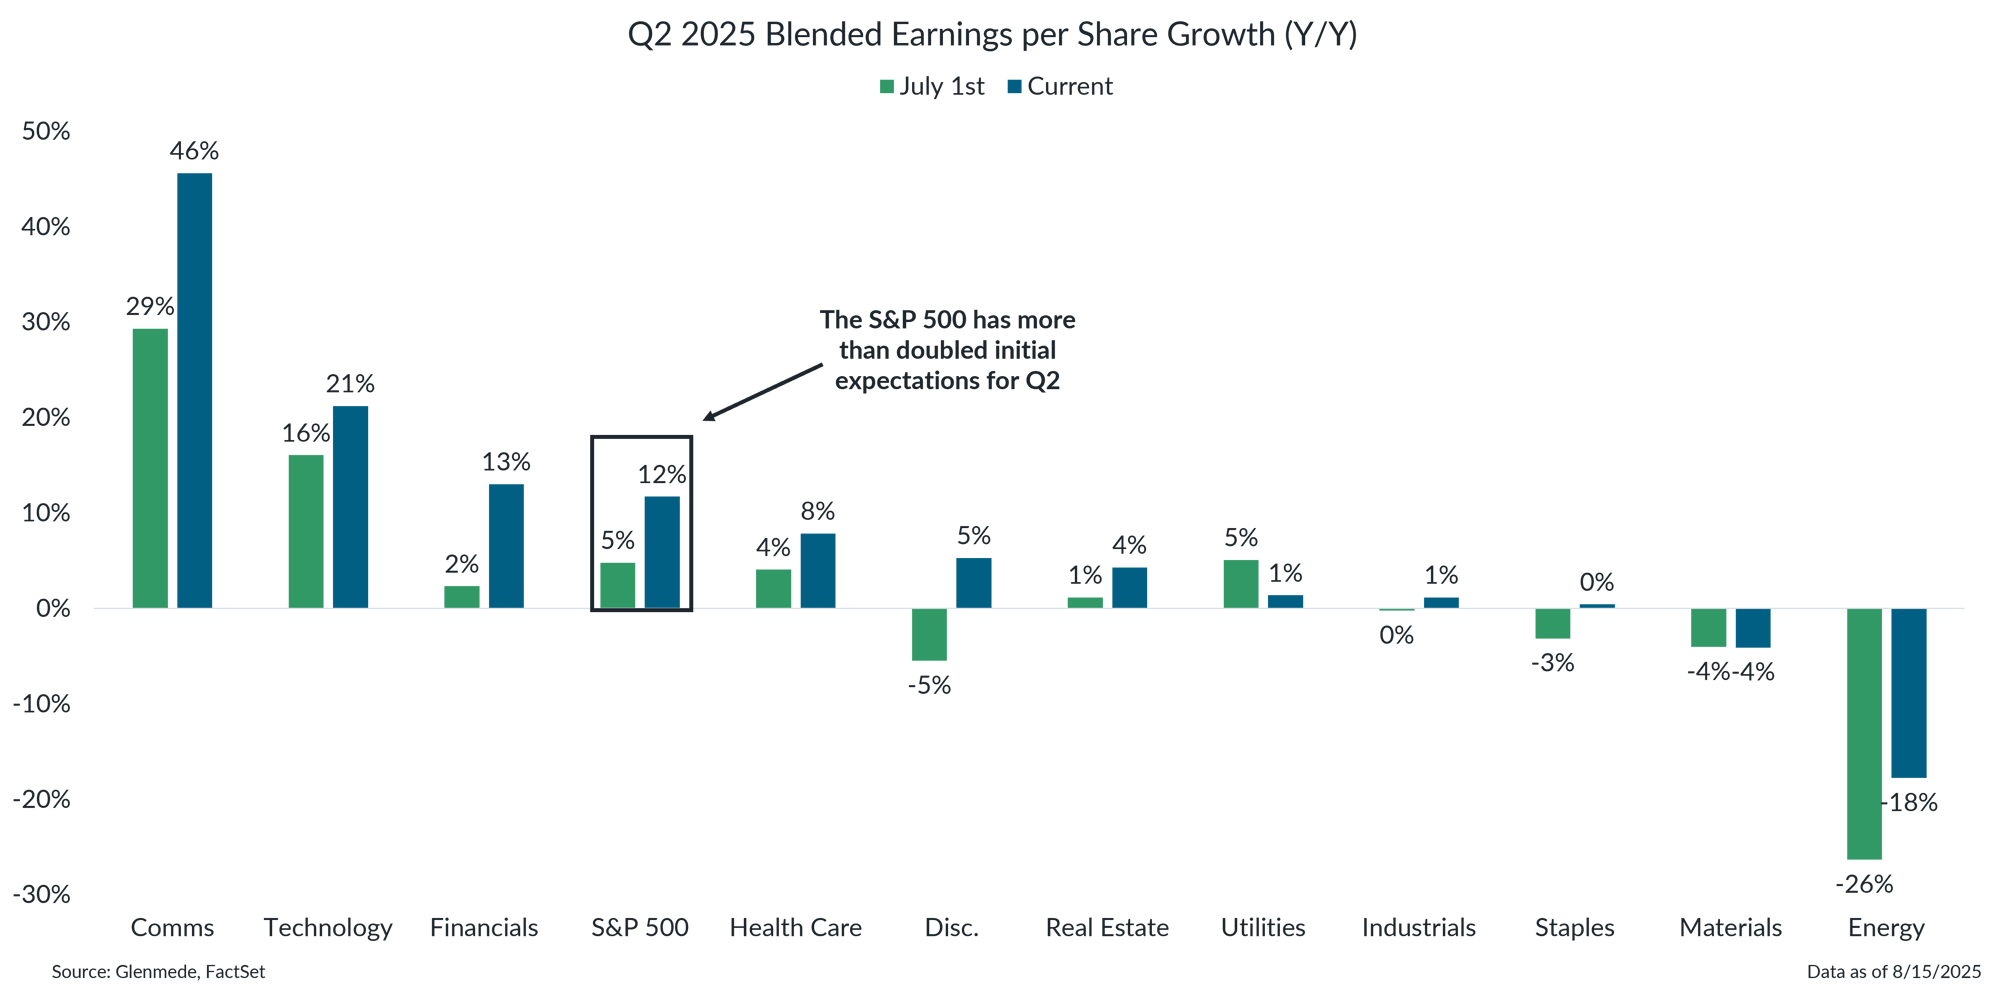
Data shown are the blended growth rates in earnings per share for the S&P 500 and its eleven constituent sectors for Q2 2025 on a year-over-year, percent change basis. Data shown in blue are as of the latest date shown and data shown in green are as of 7/1/2025. Blended growth figures combine actual results with consensus expectations for companies that have yet to report. The S&P 500 is a market capitalization weighted index of large cap stocks in the U.S. Actual results may differ materially from expectations. One cannot invest directly in an index.
- 10 out of 11 sectors in the S&P 500 have delivered earnings growth above initial expectations so far this earnings season.
- Communications, technology, and financials have seen the largest upside earnings surprises; utilities has been the only sector to underperform expectations.
Pricing data suggest businesses may be absorbing tariff costs, though this may not yet fully be reflected in margins

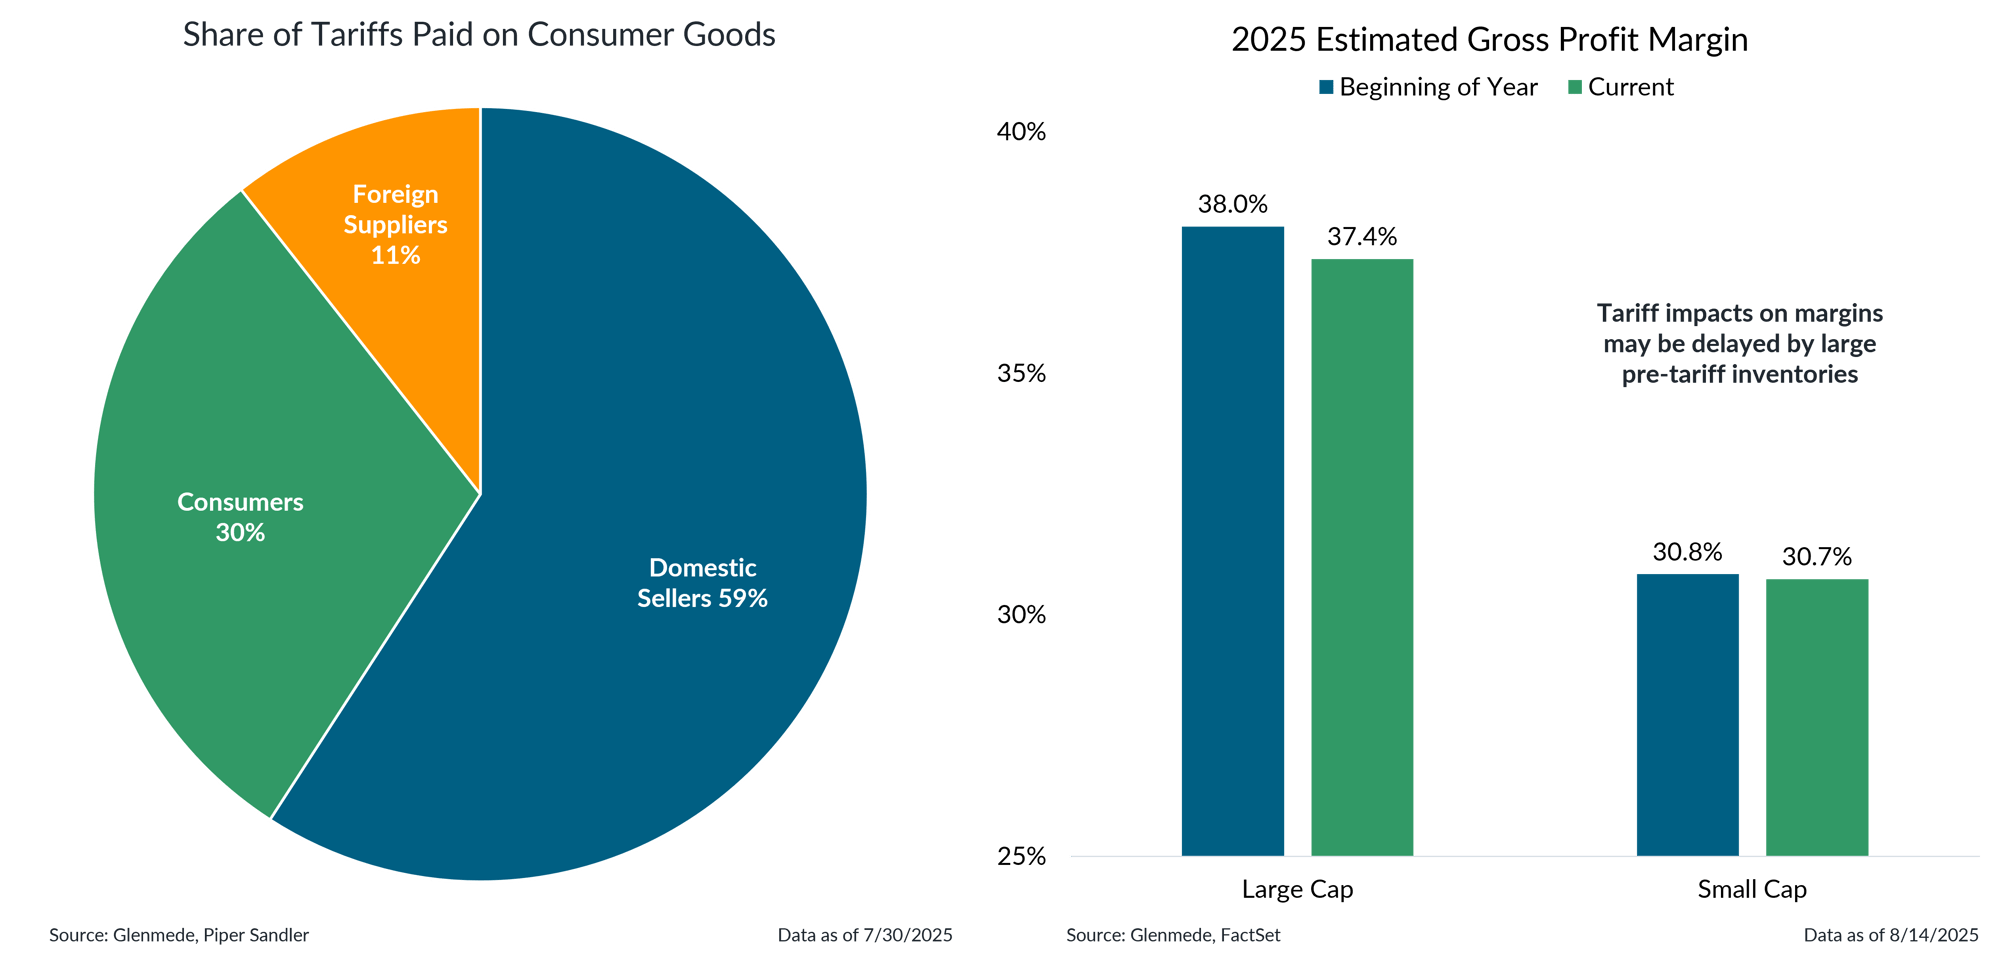
Shown in the left panel is the estimated share of consumer goods tariffs paid by foreign suppliers, domestic sellers, and consumers. The consumer share is based on the change in the Consumer Price Index (CPI) for core goods, applied to total annual consumer goods spending. The foreign supplier share is calculated by comparing changes in import prices to the value of consumer goods imports. Both are expressed as a percentage of estimated total annual tariff revenue on consumer goods. The remaining share is attributed to domestic sellers. Shown in the right panel are gross profit margin projections for 2025 based on bottom-up equity analysts’ estimates for the S&P 500 and S&P 600 indexes. Actual results may differ materially from expectations. One cannot invest directly in an index.
- Pricing data suggests that consumers are bearing roughly 30% of the tariff burden while businesses are absorbing closer to 60%.
- However, this dynamic may not yet be fully visible in company margins, as many firms are still working through sizable pre-tariff inventories.
Companies are beginning to cite benefits from the OBBBA, which may soon help sterilize tariff impacts
.png?width=2000&height=1035&name=IS%20Brief%202025-08-18%20Chart%204%20(1).png)
Show in the left panel is the sector distribution of companies reporting benefits from the “One Big Beautiful Bill Act” during Q2 earnings calls. Shown in the right panel is a non-exhaustive summary of the business provisions included in the OBBBA. TCJA refers to The Tax Cuts and Jobs Act of 2017.
- On the other hand, companies in sectors such as industrials, energy, and technology are increasingly highlighting the benefits of the business provisions in the OBBBA.
- The legislation introduces a range of tax incentives designed to support business investment and operations, which may help partially offset the tariff-related pressures companies are facing.
While large caps continue to deliver strong earnings growth, small caps are poised for a comeback

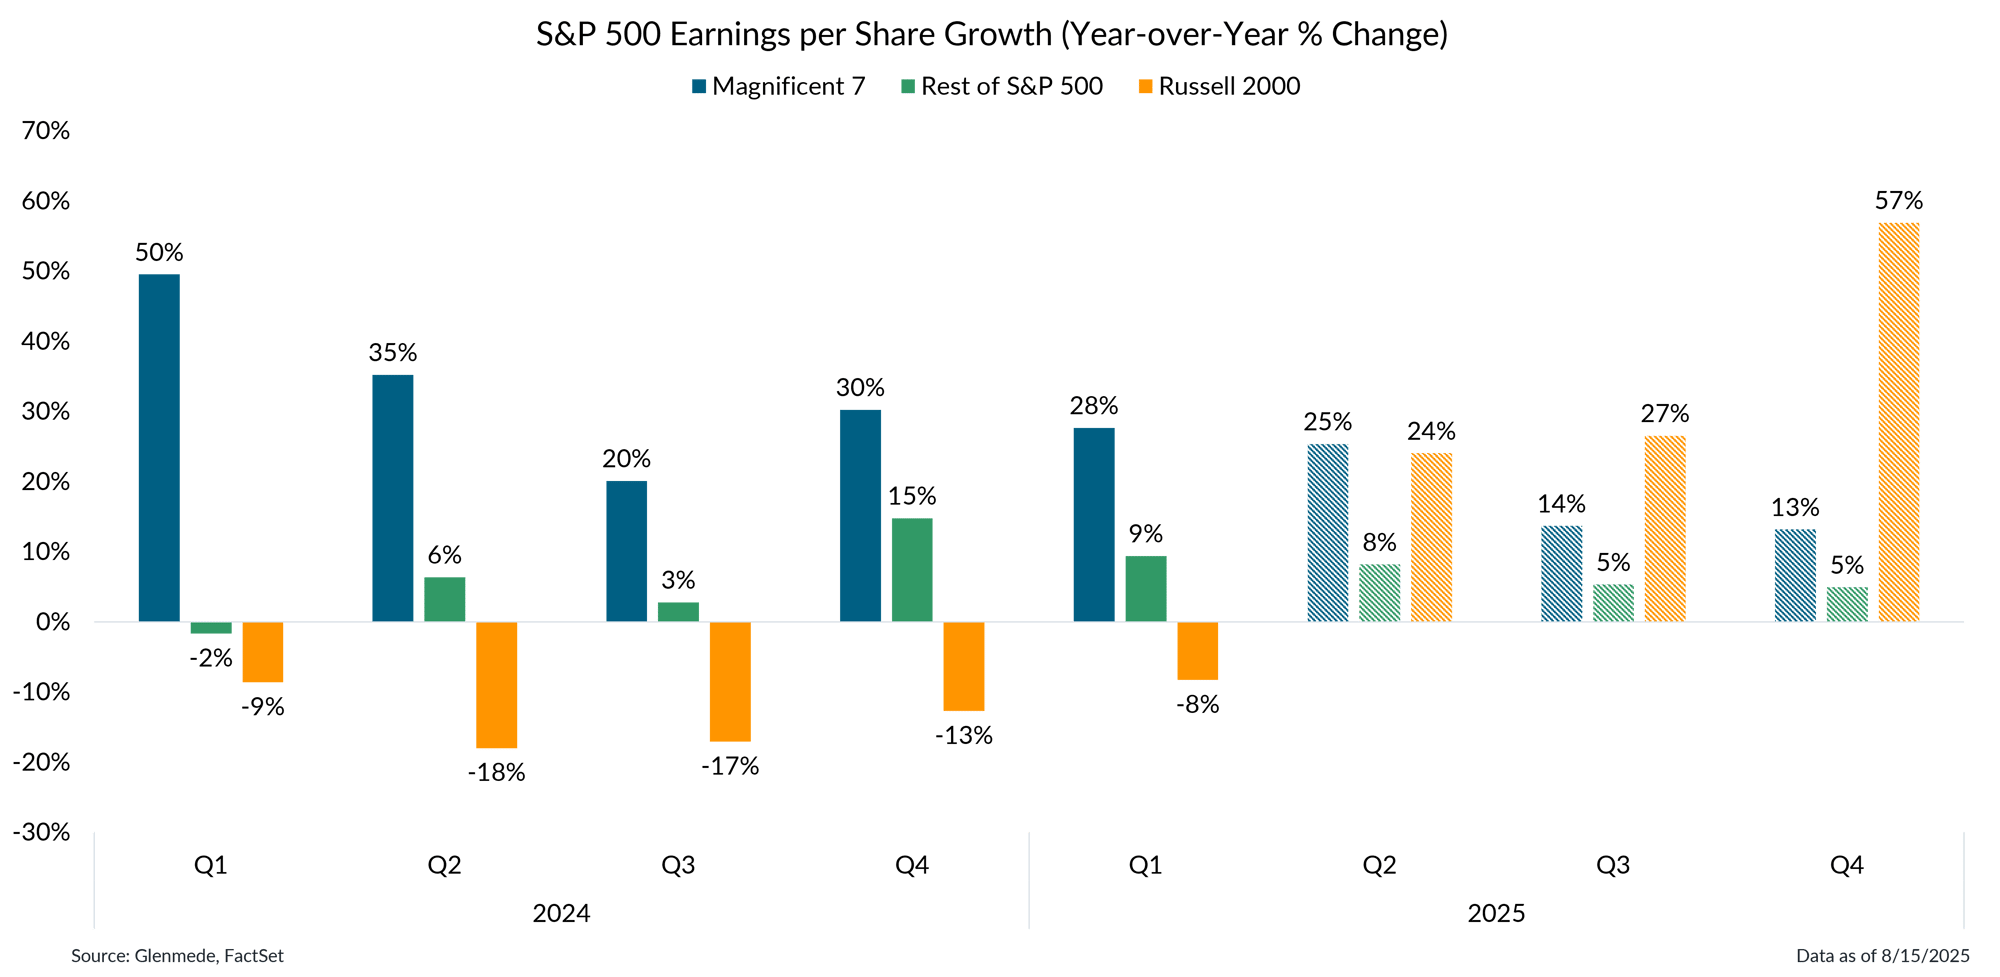
Data shown are quarterly earnings per share growth rates on a year-over-year percent change basis. Figures in blue represent the results for the Magnificent 7 (Apple, Amazon, Alphabet, Meta, Microsoft, Nvidia, Tesla), figures in green represent the rest of the stocks in the S&P 500 index, and figures in orange represent the Russell 2000 index. Solid bars represent actual results, and hashed bars represent projections based on bottom-up equity analysts’ estimates. Past performance may not be indicative of future results. Actual results may differ materially from expectations. One cannot invest directly in an index. References to specific stocks should not be construed as advice to buy, hold, or sell individual securities.
- Over the last few years, earnings growth results have been a sliding scale down the cap spectrum led by strong results from the Magnificent 7 and disappointment from small caps.
- Q2 may be a key turning point, as small caps appear to be picking up steam into the back half of 2025.
This material is provided solely for informational and/or educational purposes and is not intended as personalized investment advice. When provided to a client, advice is based on the client’s unique circumstances and may differ substantially from any general recommendations, suggestions or other considerations included in this material. Any opinions, recommendations, expectations or projections herein are based on information available at the time of publication and may change thereafter. Information obtained from third-party sources is assumed to be reliable but may not be independently verified, and the accuracy thereof is not guaranteed. Any company, fund or security referenced herein is provided solely for illustrative purposes and should not be construed as a recommendation to buy, hold or sell it. Outcomes (including performance) may differ materially from any expectations and projections noted herein due to various risks and uncertainties. Any reference to risk management or risk control does not imply that risk can be eliminated. All investments have risk. Clients are encouraged to discuss any matter discussed herein with their Glenmede representative.

