Investment Strategy Brief
Q3 2025 Market Review
October 5, 2025

Executive Summary
- Equity markets continued to climb in Q3, while bond yields drifted lower amid a Federal Reserve easing cycle.
- Major asset class returns showed broad resilience in Q3, led by strong gains for small caps.
- The Fed resumed its rate cute campaign and is expected to move to a more neutral posture.
- Valuations remained elevated in U.S. large cap but more reasonable elsewhere.
- Investors should maintain neutral positioning while actively looking to rebalance and diversify portfolios.
Equity markets continued to climb in Q3, while bond yields drifted lower amid a Fed easing cycle
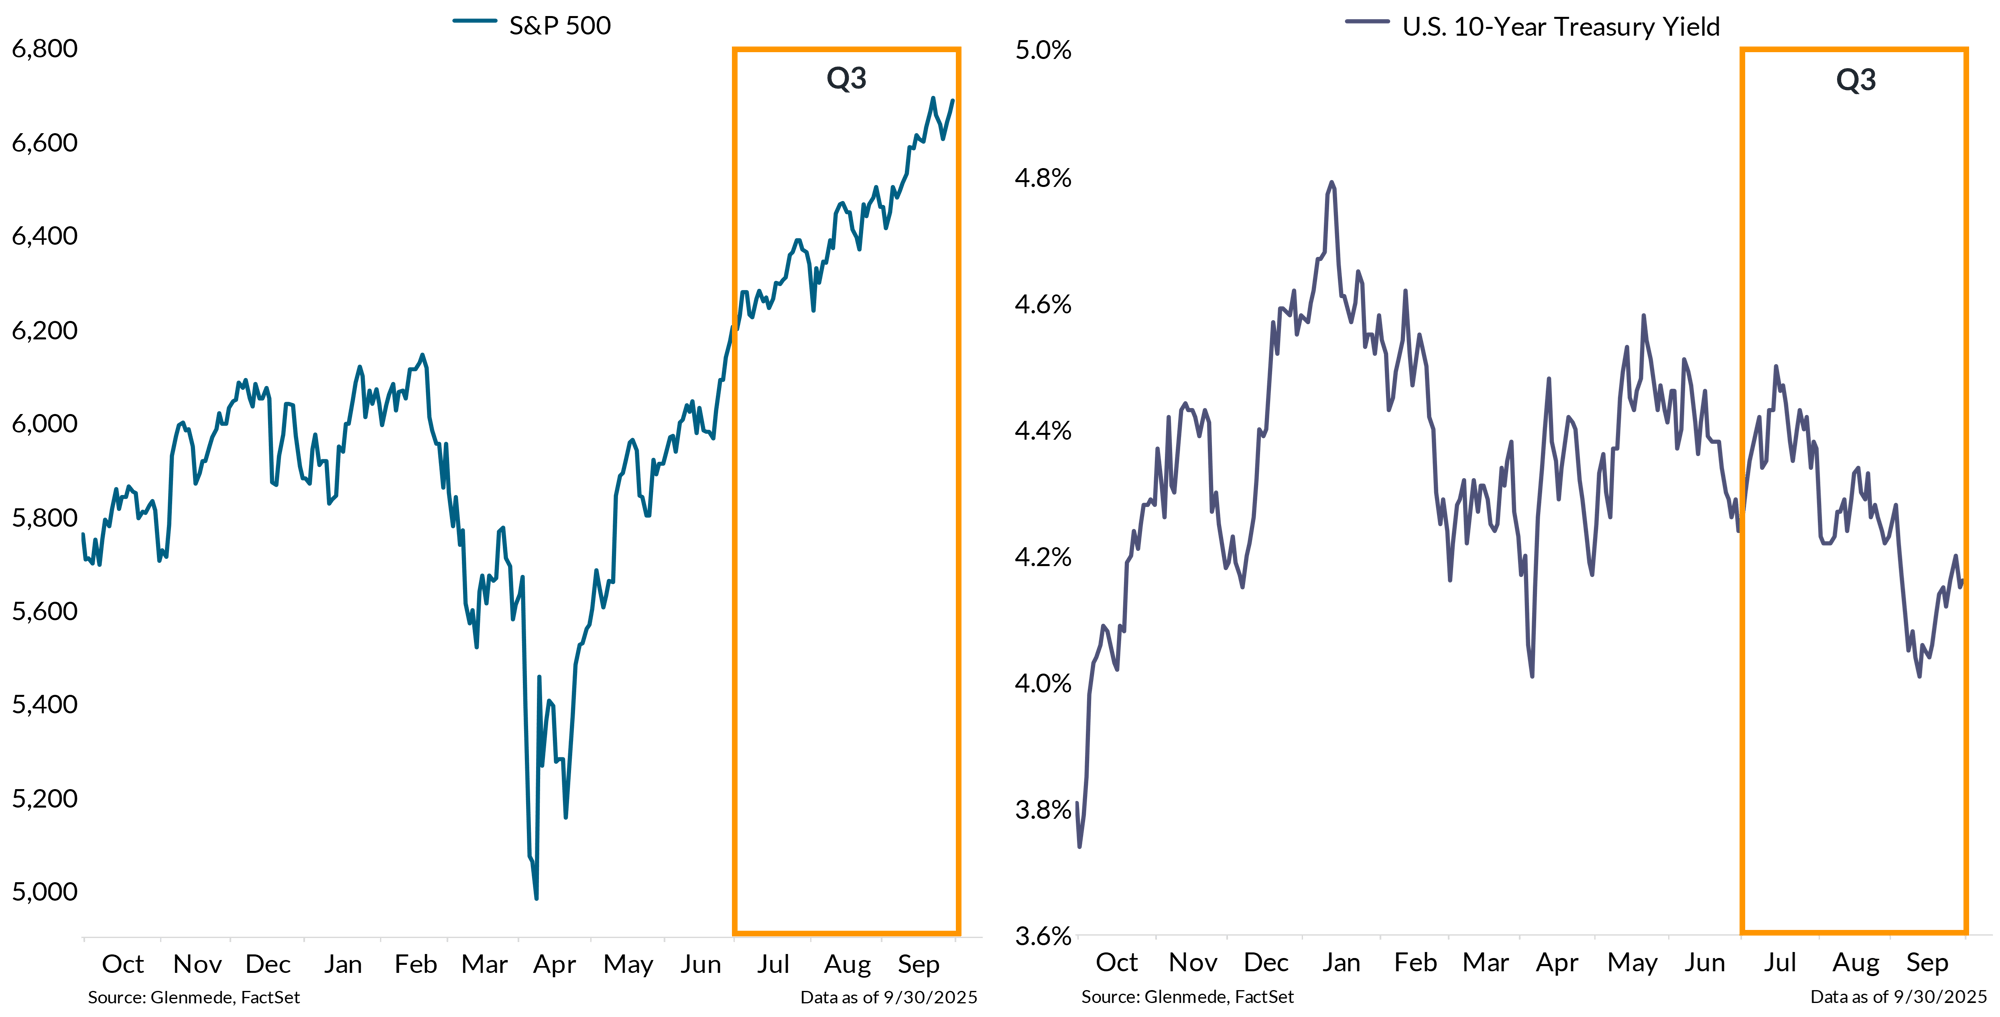
Shown in the left panel is the S&P 500 which is a market capitalization weighted index of U.S. large cap stocks. Shown in the right panel is the yield on 10-year U.S. Treasury bonds. Past performance may not be indicative of future results. One cannot invest directly in an index.
- The S&P 500 climbed steadily in Q3, supported by improving market sentiment and expectations of easing financial conditions.
- The U.S. 10-Year Treasury yield drifted lower as the Fed cut rates in September and signaled a shift toward a renewed easing cycle.
Major asset class returns showed broad resilience in Q3, led by strong gains for small caps
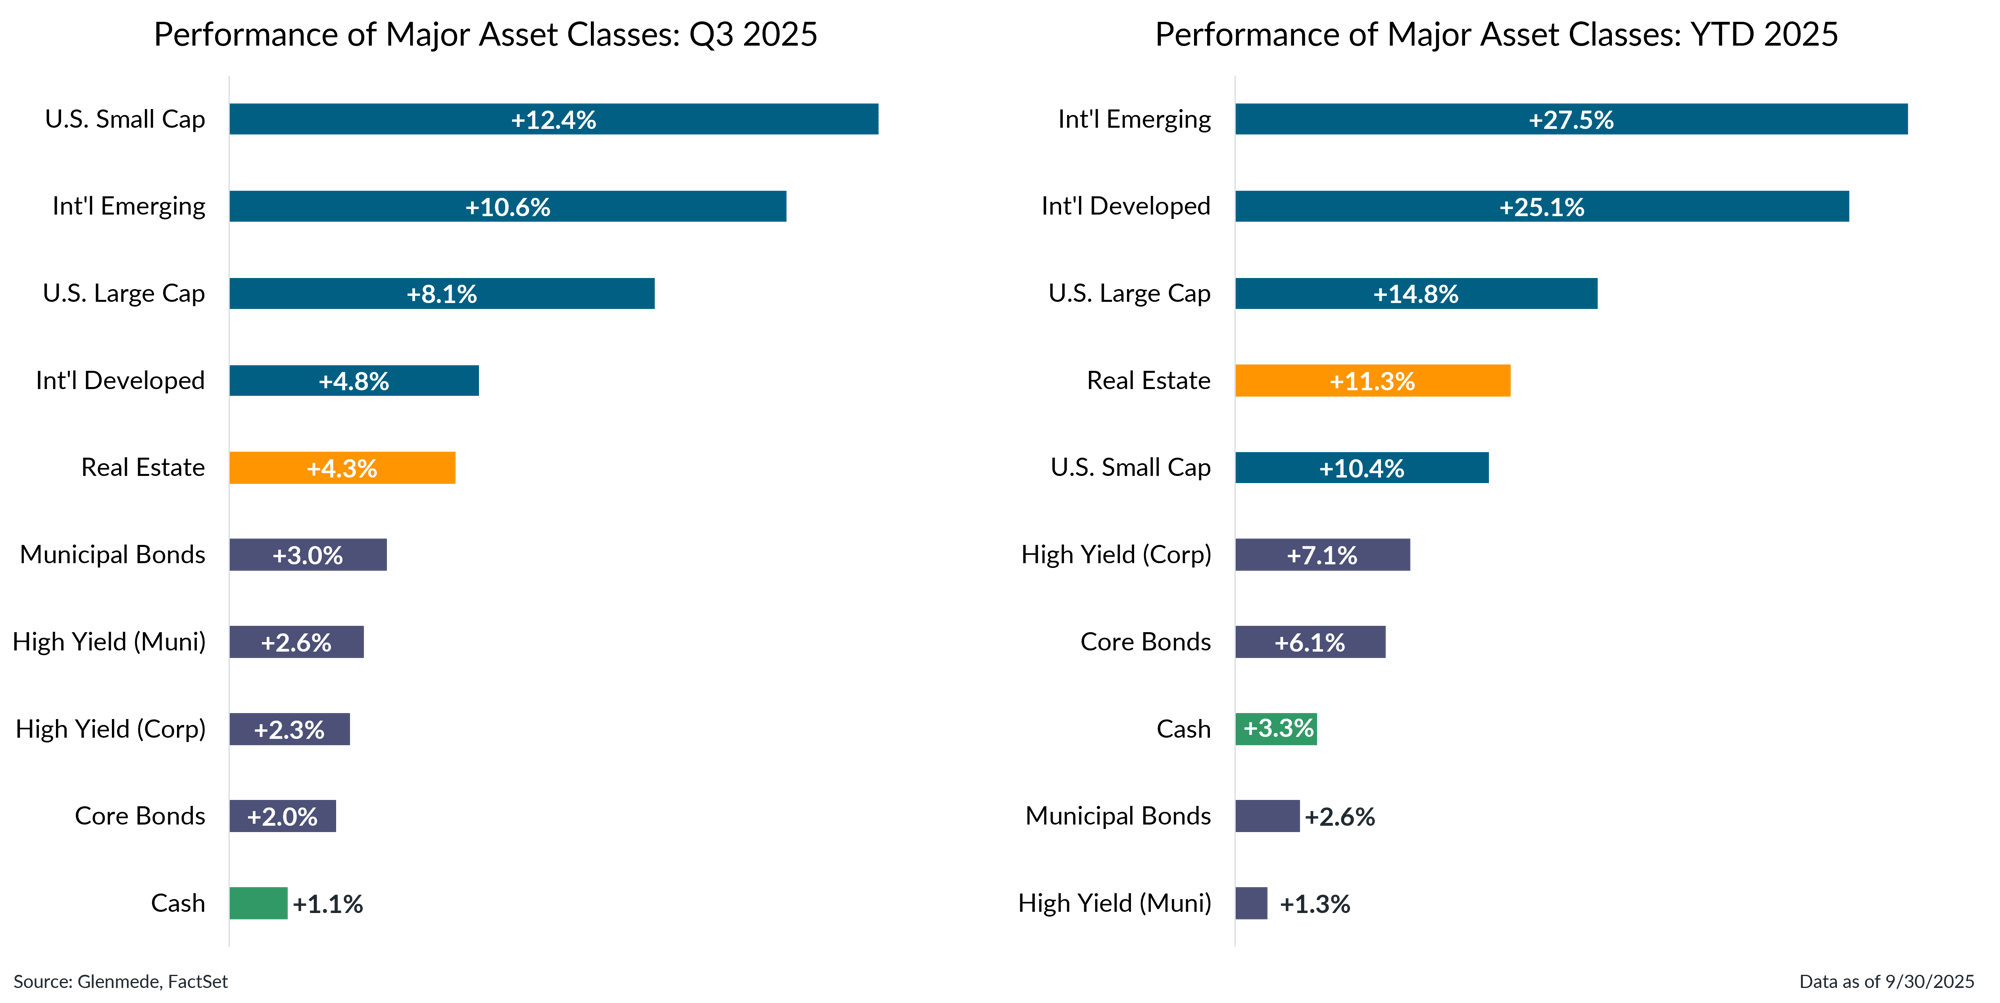
Shown are calendar Q3 2025 and year to date 2025 total returns for various asset classes represented by the following indices: U.S. Large Cap (S&P 500), U.S. Small Cap (Russell 2000), Int’l Developed (MSCI EAFE), Int’l Emerging (MSCI EM), Real Estate (FTSE EPRA/NAREIT Developed), Core Bonds (Bloomberg U.S. Aggregate), Municipal Bonds (Bloomberg Municipal), High Yield (Corp) (Bloomberg U.S. High Yield Ba to B), High Yield (Muni) (Bloomberg Municipal High Yield), Cash (FTSE 3-Month Treasury Bills). Past performance may not be indicative of future results. One cannot invest directly in an index.
- Major asset classes delivered positive returns in Q3, with small caps leading the way (+12.4%), outperforming large caps.
- International developed and emerging markets continued to set the pace on a year-to-date basis with double-digit returns, due to improving fundamentals abroad and a weakening dollar.
Tariff policy has found a tentative equilibrium and may soon be offset by fiscal stimulus
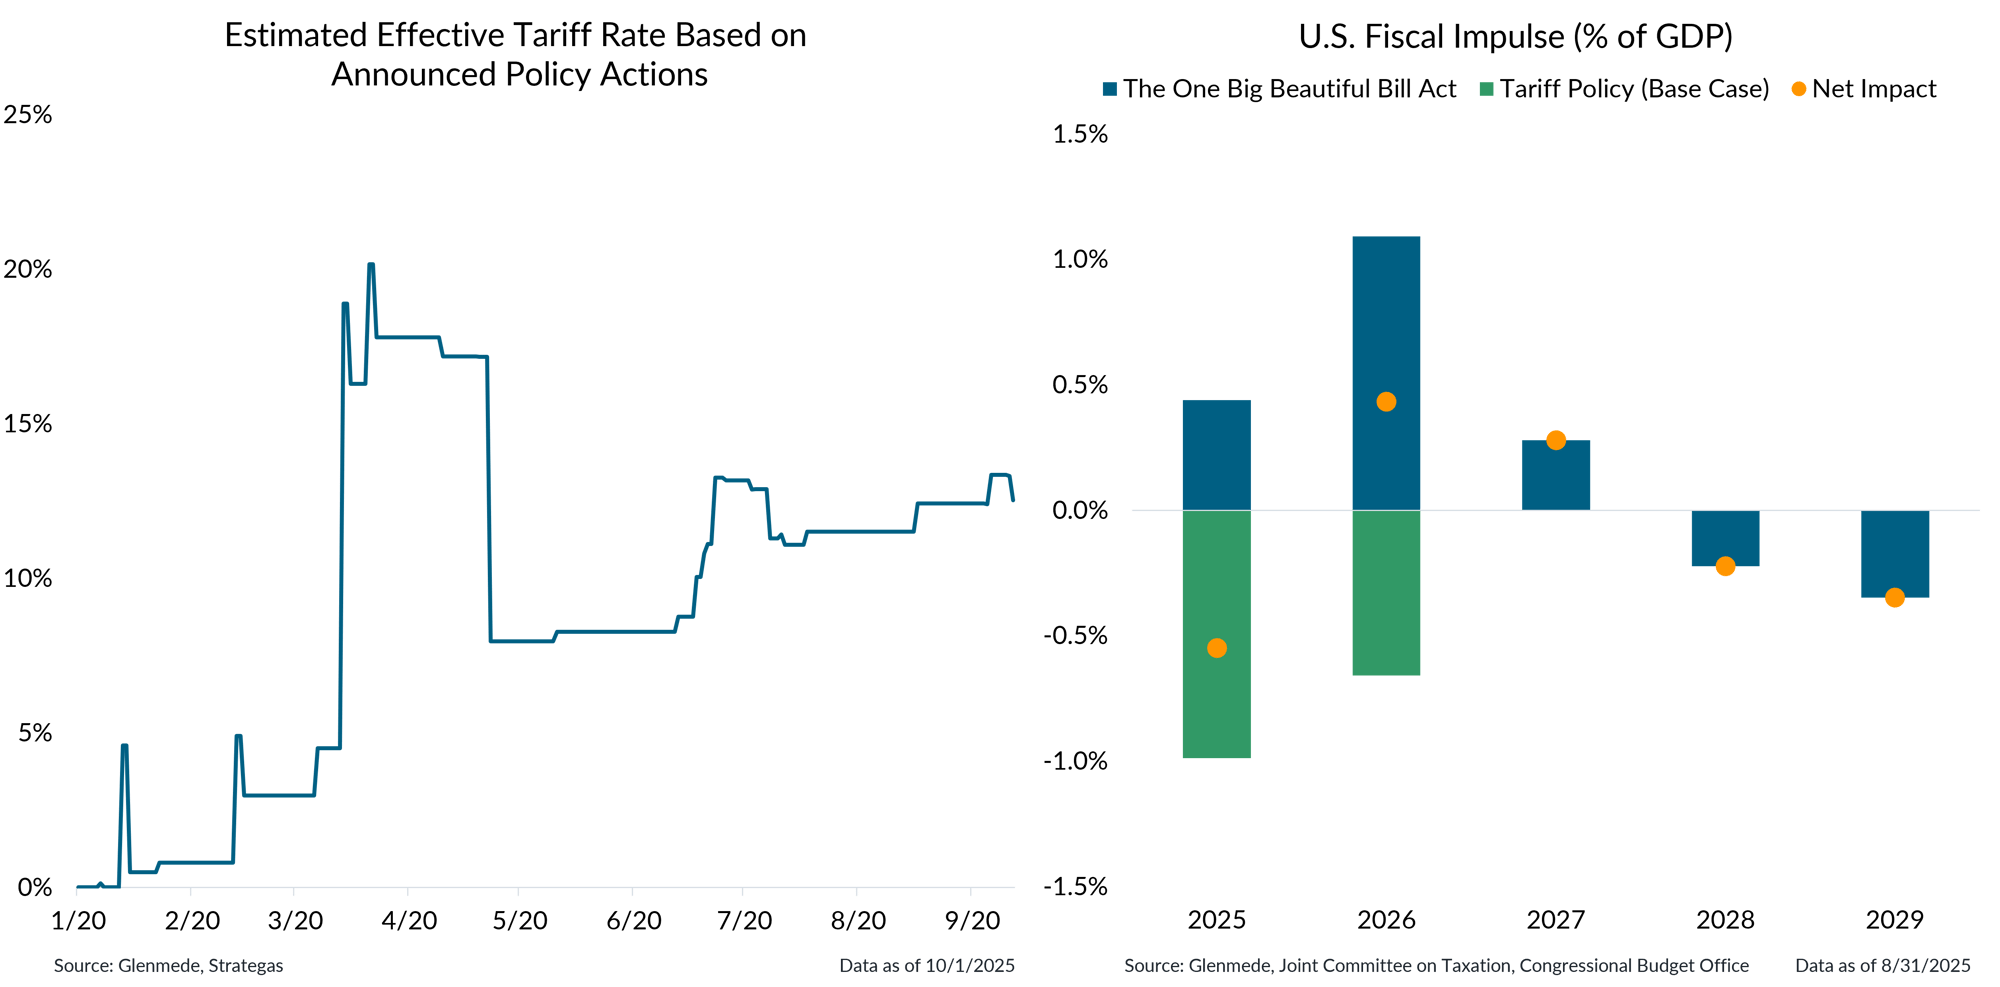
Shown in the left panel is a timeline of the estimated effective tariff rate based on tariffs announced as of each day since President Trump’s second inauguration. The effective tariff rate is expressed as a percentage, calculated as estimated revenues from tariffs over total imports. Historical and projected tariff figures are derived from internal and third-party sources believed to be reliable. Shown in the right panel are the expected fiscal stimulus effects by year due to key policy changes associated with The One Big Beautiful Bill Act and Glenmede’s Base Case projection for revenues generated by new tariffs. Orange dots represent the net impact between both dimensions of policy change. Actual results may differ materially from projections and are subject to change.
- Tariff policy has leveled off, with the effective tariff rate stabilizing around 13% after sharp increases earlier in the year.
- Fiscal stimulus, particularly from The One Big Beautiful Bill Act, is expected to offset tariff headwinds in the near term, leading to a modest net positive impact on growth in 2026.
The Fed resumed its rate cut campaign and is expected to move to a more neutral posture
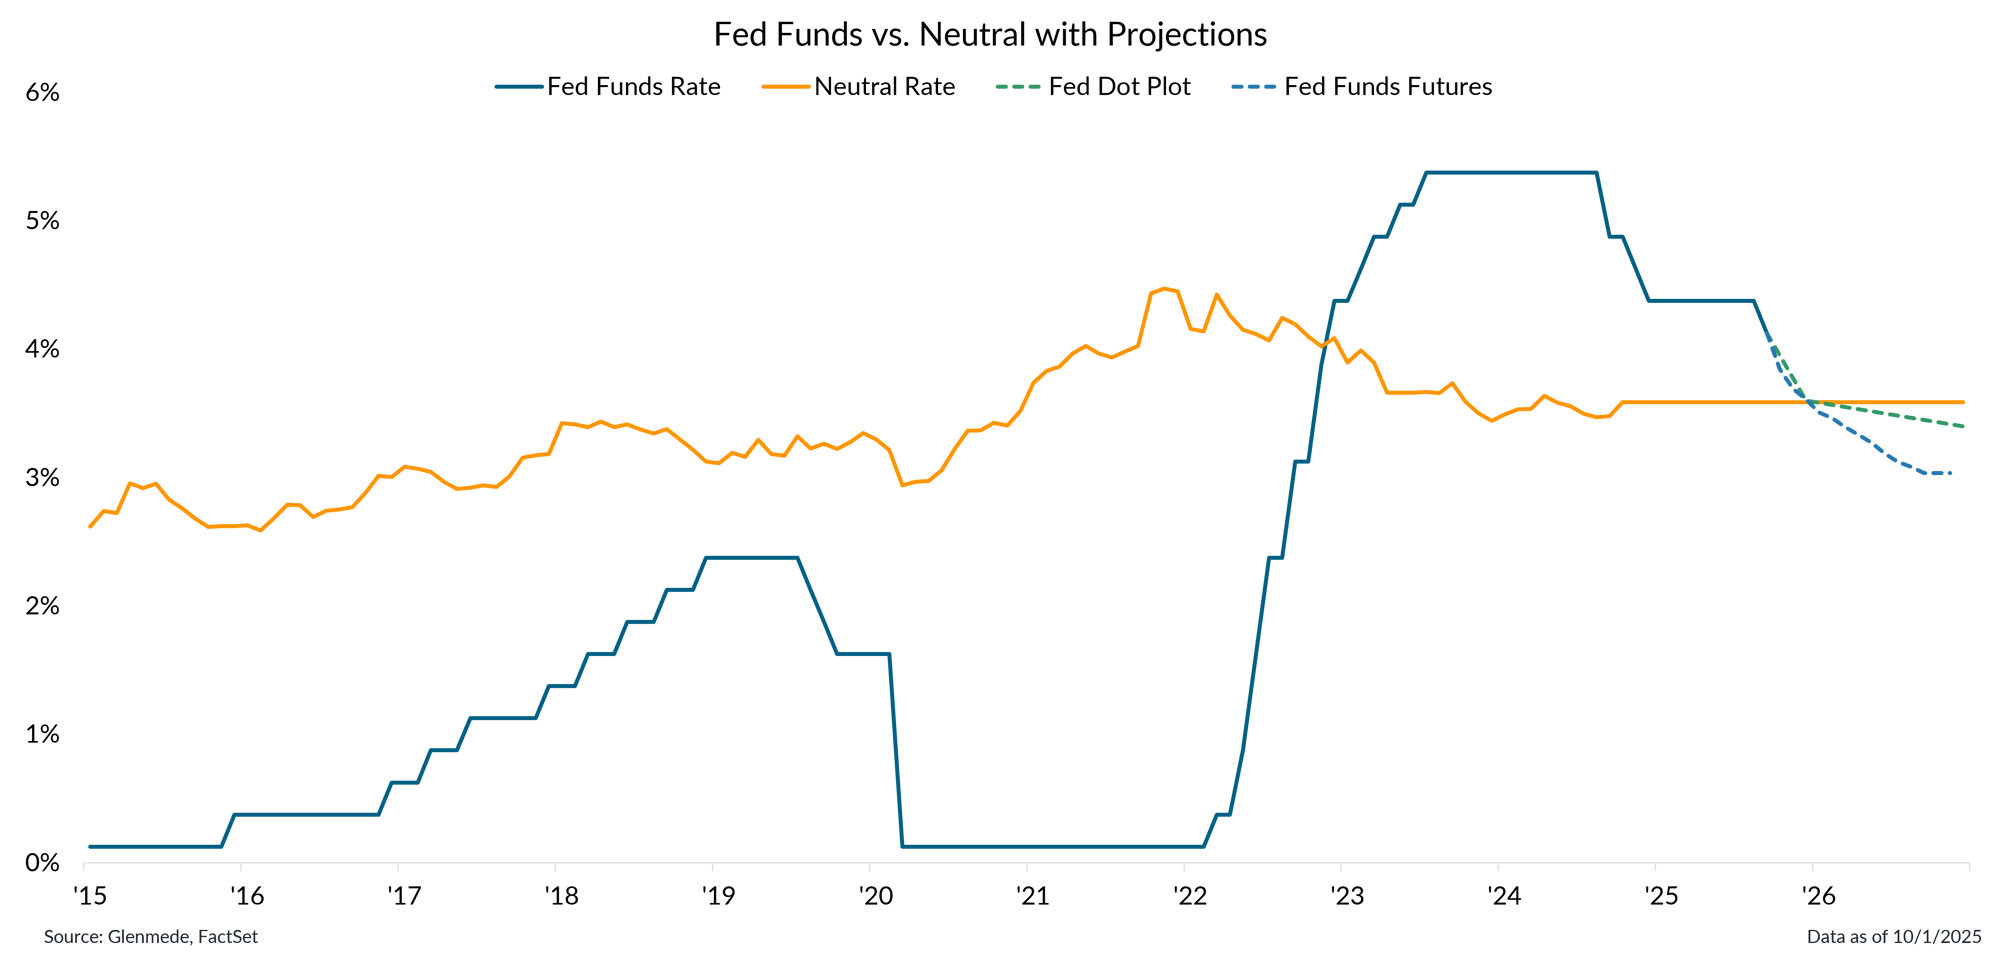
Data shown in orange are Glenmede’s estimates of the neutral federal funds rate over time (i.e., the level of rates that is neither economically stimulative nor restrictive) based on expectations for real interest rates via the Holston-Laubach-Williams model and Glenmede’s 10yr inflation expectations. Fed Funds Rate in blue is the target rate midpoint. The dashed blue line represents expectations for the forward path of rates based on fed funds futures pricing. The dashed green line represents expectations for the forward path of rates based on the median respondent in the Federal Open Market Committee’s dot plot projections. Actual results may differ materially from projections.
- The Fed has resumed its rate cut campaign, with both markets and policymakers projecting a shift toward a more neutral policy level over the coming year.
- However, market pricing suggests a more aggressive rate cut path than the Fed’s own projections, anticipating rates to fall below the estimated neutral rate.
Valuations remain elevated in U.S. large cap but more reasonable elsewhere
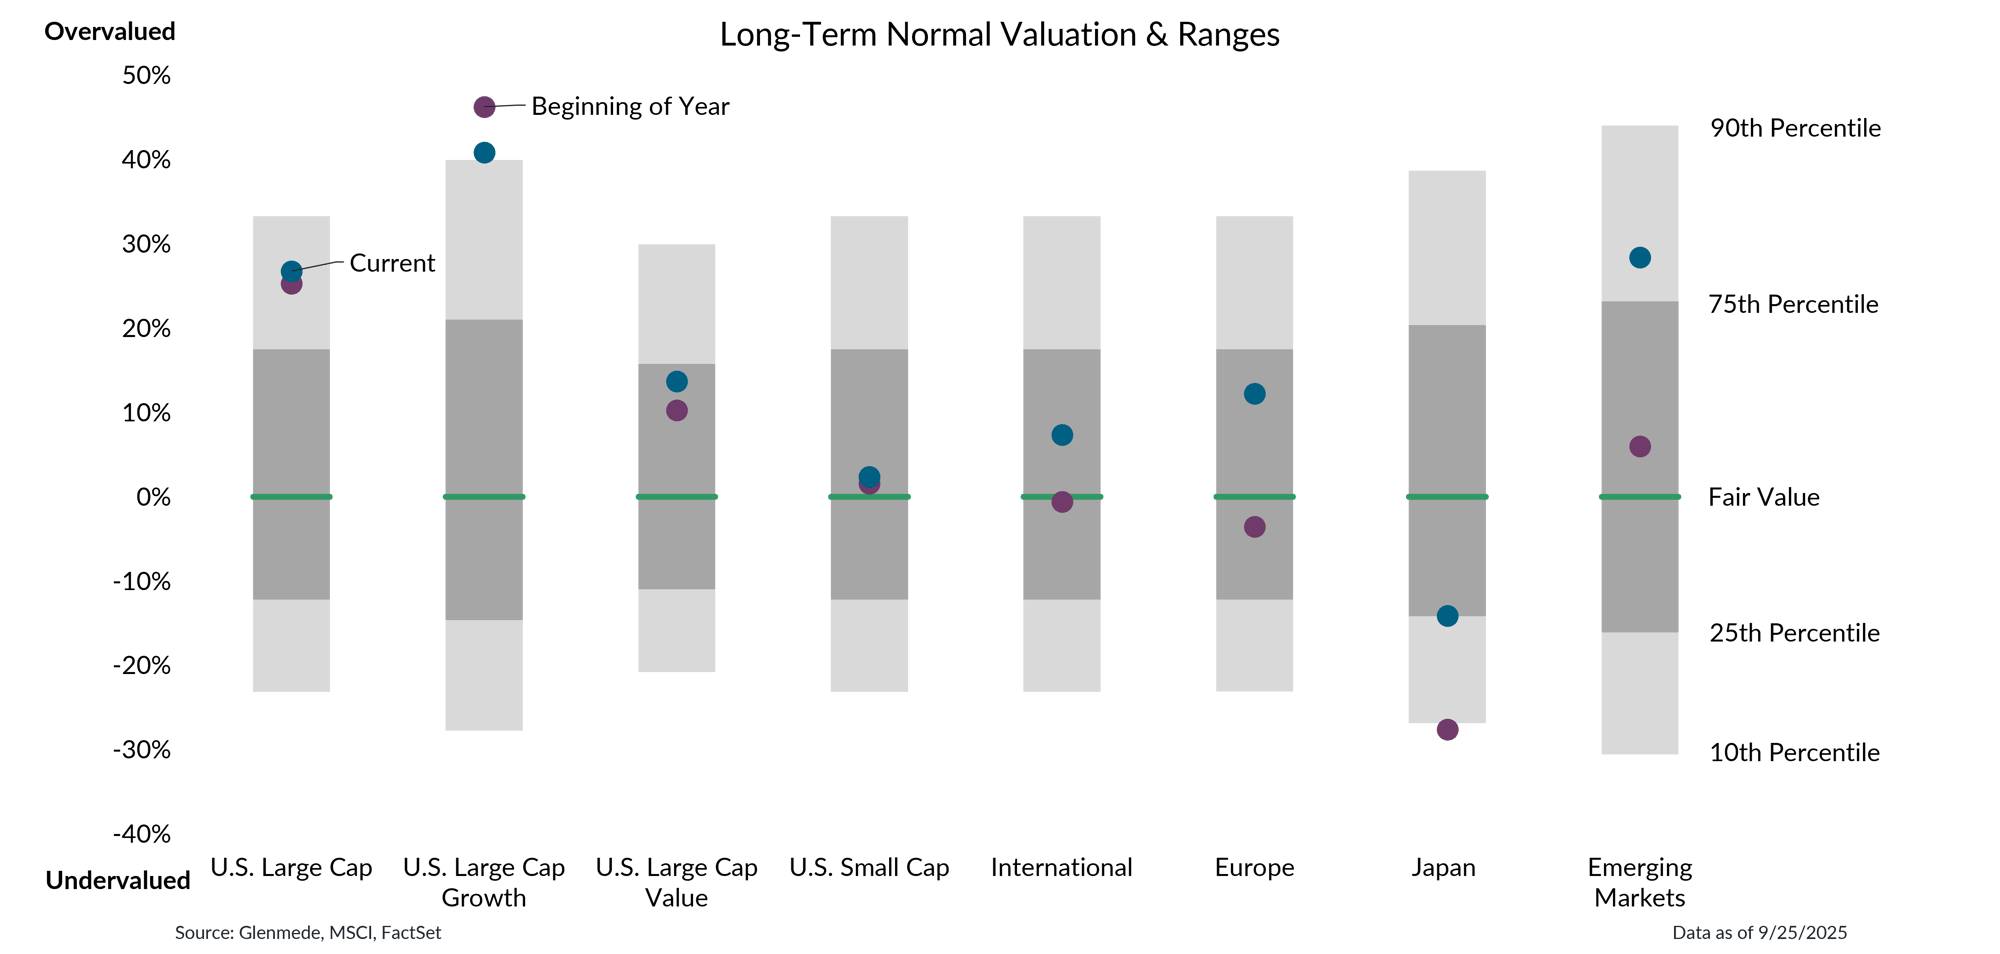
Data shown are Glenmede’s estimates of long-term fair value for U.S. Large Cap (MSCI USA), U.S. Large Cap Growth (MSCI USA Growth), U.S. Large Cap Value (MSCI USA Value), U.S. Small Cap (MSCI USA Small), International (MSCI All Country World ex-U.S.), Europe (MSCI Europe), Japan (MSCI Japan), and Emerging Markets (MSCI EM) based on normalized earnings, normalized cash flows, dividend yield, and book value for each index. Blue dots represent current valuation levels and purple dots represent valuation levels at the beginning of 2025. Glenmede’s estimates of fair value are arrived at in good faith, but longer-term targets for valuation may be uncertain. One cannot invest directly in an index.
- Valuations in large cap equities remain elevated relative to long-term fair value, particularly in growth sectors, suggesting that expectations for earnings are still priced at a premium compared with historical norms.
- Outside of large caps, valuations appear more balanced, with small cap and international developed markets trading closer to fair value levels.
This material is provided solely for informational and/or educational purposes and is not intended as personalized investment advice. When provided to a client, advice is based on the client’s unique circumstances and may differ substantially from any general recommendations, suggestions or other considerations included in this material. Any opinions, recommendations, expectations or projections herein are based on information available at the time of publication and may change thereafter. Information obtained from third-party sources is assumed to be reliable but may not be independently verified, and the accuracy thereof is not guaranteed. Any company, fund or security referenced herein is provided solely for illustrative purposes and should not be construed as a recommendation to buy, hold or sell it. Outcomes (including performance) may differ materially from any expectations and projections noted herein due to various risks and uncertainties. Any reference to risk management or risk control does not imply that risk can be eliminated. All investments have risk. Clients are encouraged to discuss any matter discussed herein with their Glenmede representative.

