Investment Strategy Brief
Signals from the Bond Market
April 20, 2025

Executive Summary
- The Federal Reserve may continue to cut rates this year if inflation expectations stay anchored and growth uncertainties continue.
- Higher Treasury yields reflect a term premium over short rates that has returned to a more normal positive level.
- Factors influencing the term premium include foreign demand, deficit concerns and the Fed’s balance sheet normalization.
- More fixed income yields are in the vicinity of fair value levels, though there may be opportunities in core municipals, which appear undervalued.
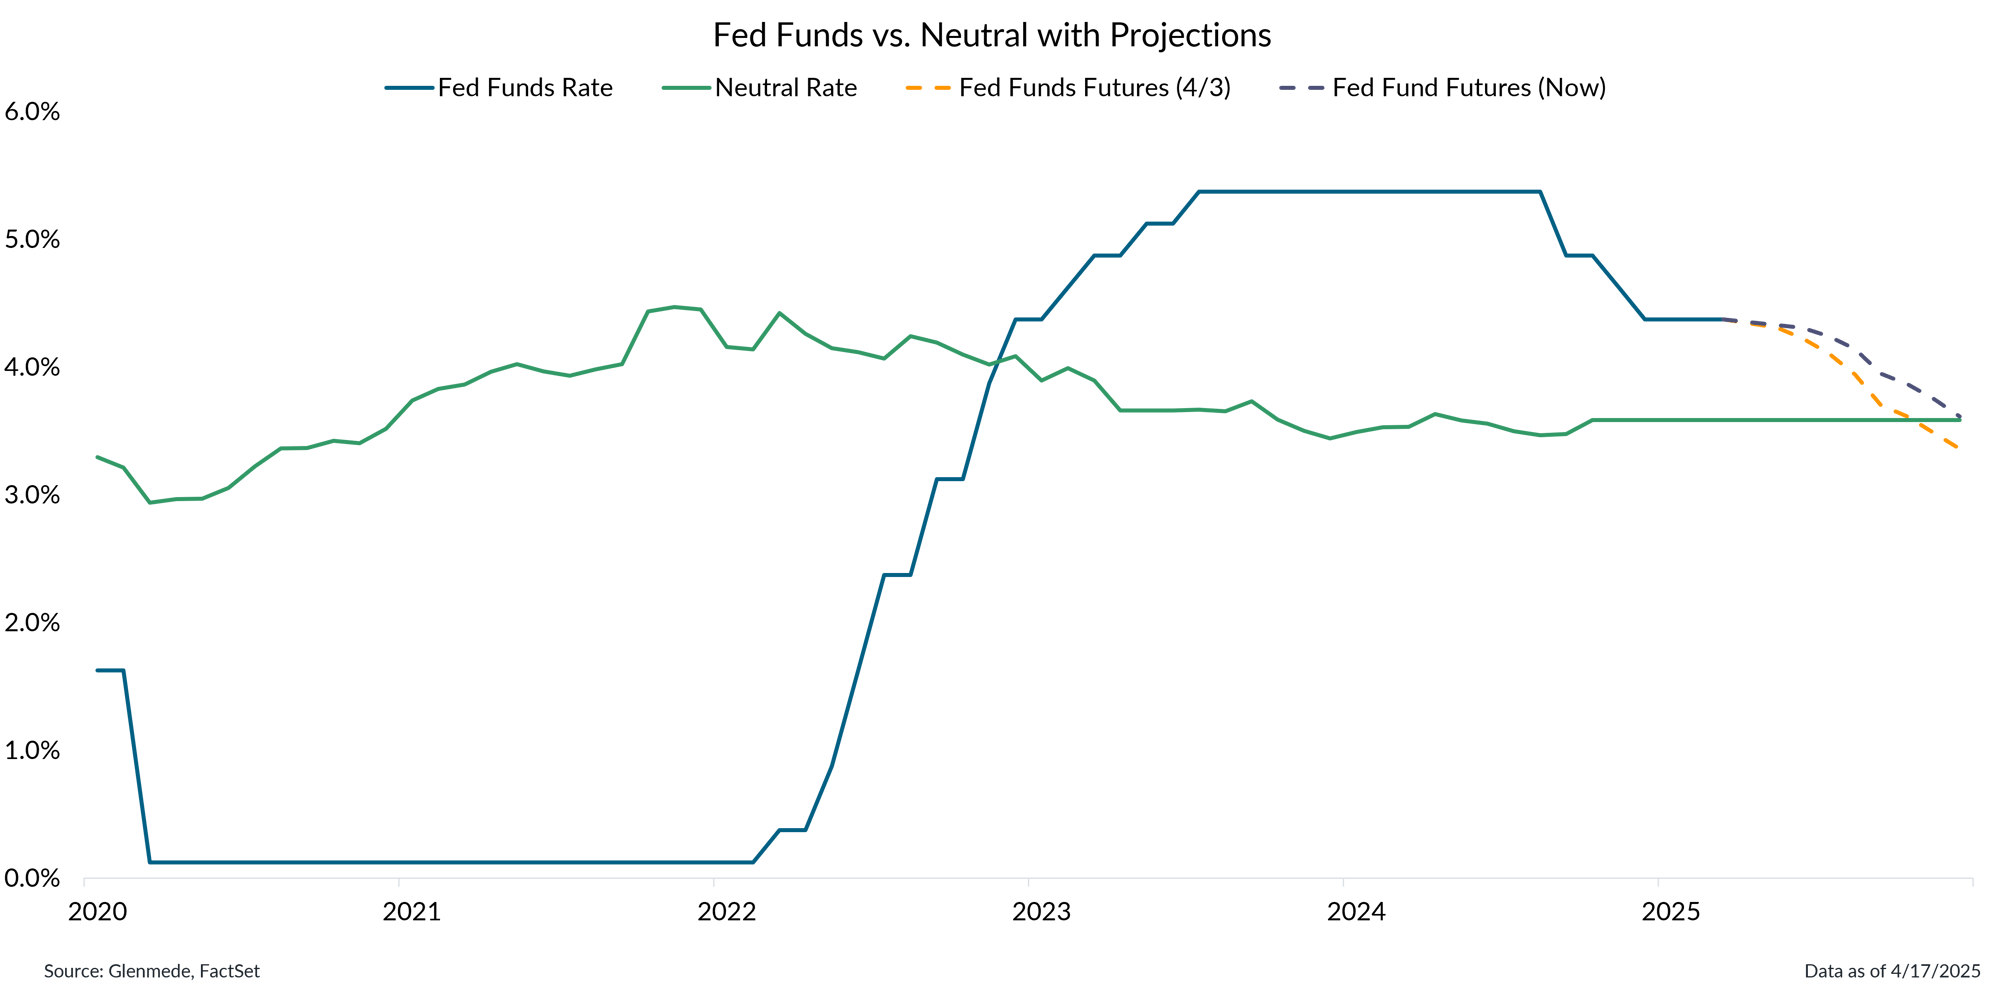
The Fed is expected to continue its rate cuts, although the exact path may depend on the impact of trade policy

Data shown in green are Glenmede’s estimates of the neutral federal funds rate over time (i.e., the level of rates that is neither economically stimulative nor restrictive) based on expectations for real interest rates via the Holston-Laubach-Williams model and Glenmede’s 10-year inflation expectations. Fed Funds Rate in blue is the target rate midpoint. The dashed orange line represents projections based on federal funds futures as of April 3. The dashed purple line represents projections based on federal funds futures, as of the latest date. Actual results may differ materially from projections.
- After the announcement of reciprocal tariffs, growth concerns initially drove federal funds futures to price in a quicker pace of rate cuts for the year, though those expectations have since been pared back following the pause in tariff implementation.
- Amid ongoing uncertainty surrounding trade policy and its potential impact, the Fed is expected to proceed cautiously and rely on incoming data to guide its next moves.
Long-term inflation expectations remain anchored, while credit markets exhibit some growth uncertainty

Data shown in the left panel are 10-year Treasury Inflation Protected Securities (TIPS) inflation breakeven rates, with a reference line at 2% representing the Fed’s inflation target. Data shown in the right panel are option-adjusted spreads for the Bloomberg U.S. High Yield (BB/B) index, with a solid reference line for the average spread over the period shown and dashed reference lines for one standard deviation from the average. Gray shaded areas represent periods of recession in the U.S. Past performance may not be indicative of future results. One cannot invest directly in an index. Actual results may differ materially from expectations.
- Long-term inflation expectations remain anchored despite the fluctuation in short-term inflation expectations due to shifting government policy.
- While credit spreads have widened in response to rising growth concerns, they continue to signal a moderate level of caution rather than a crisis scenario.
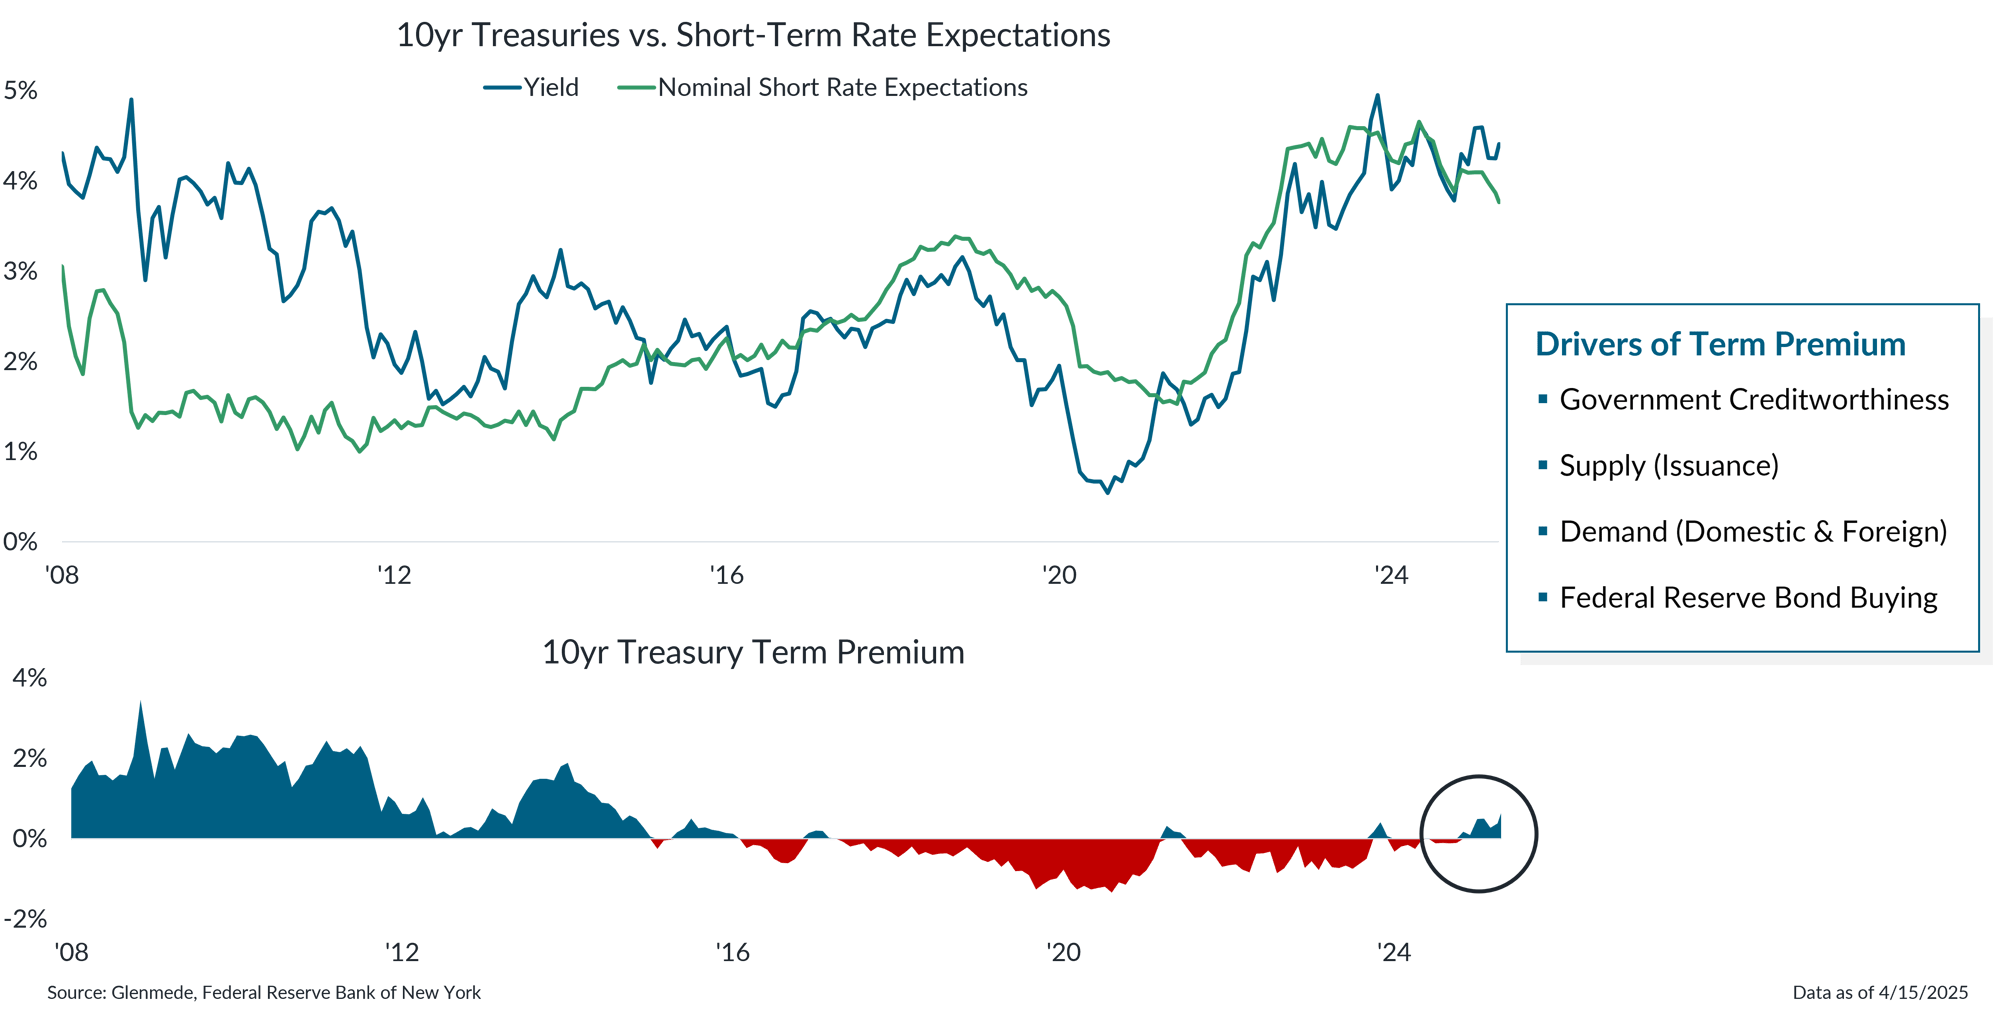
Higher Treasury yields reflect a term premium over short rates that has returned to a more normal positive level

Data shown in the top panel are the 10-year U.S. Treasury yield in blue and expectations for the average level of short-term yields over the next 10 years in green. Data shown in the bottom panel are the differences between those two values, also known as the term premium, with positive values graphed in blue and negative values graphed in red. The list of drivers of the term premium covers major drivers but is not intended to represent an exhaustive list of all factors that can influence the term premium. Actual results may differ materially from expectations.
- A rise in term premium has been driving yields higher as investors demand greater compensation for taking on long-term risk amid ongoing economic uncertainties.
- Key factors influencing the term premium include the Fed pulling back on its Treasury holdings, some concerns over the government’s deficit spending trajectory and foreign demand.
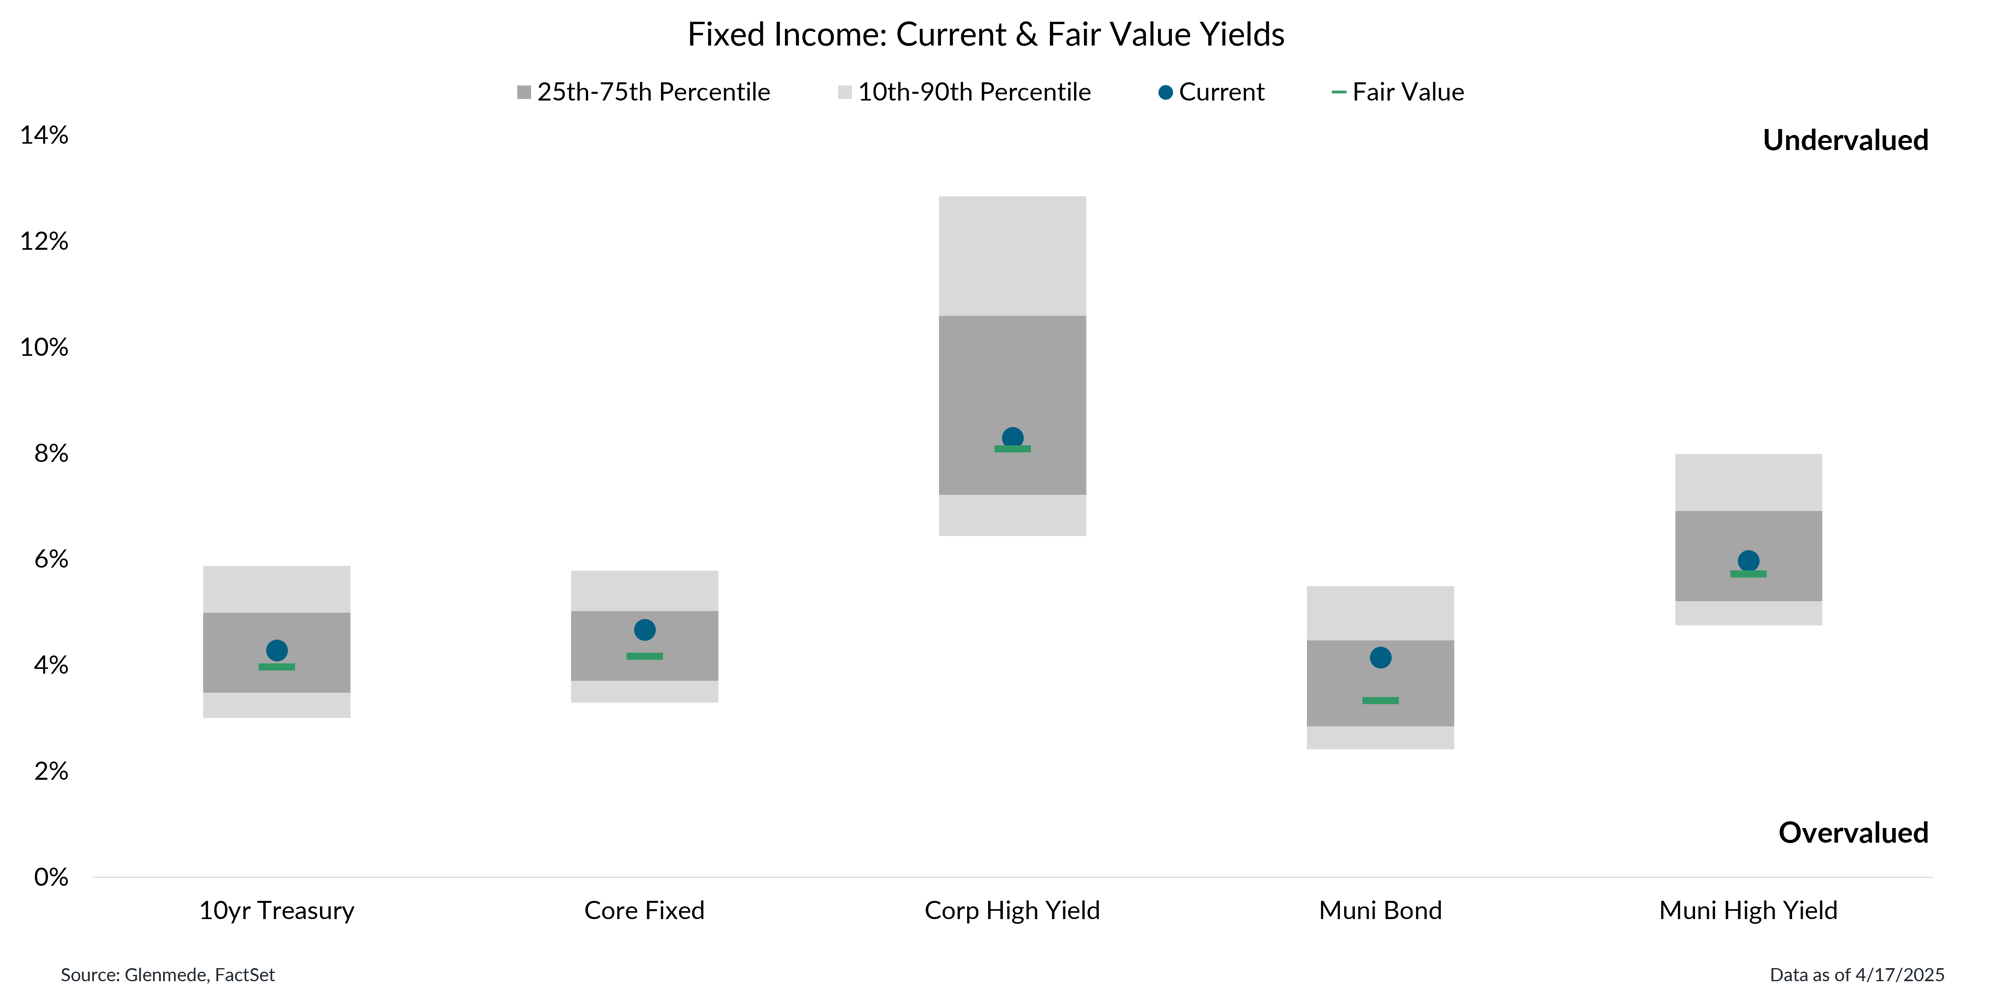
Most fixed income yields are in the vicinity of fair value levels, though core municipals appear undervalued

Shown are Glenmede’s estimates of long-term fair value for taxable and tax-exempt debt securities. Proxy indices for each asset class are as follows: Core Fixed (Bloomberg U.S. Aggregate), Corp High Yield (Bloomberg U.S. Aggregate Credit Corporate High Yield BB), Muni Bond (Bloomberg Municipal Bond), Muni High Yield (Bloomberg Municipal High Yield). Glenmede’s estimates of fair value are arrived at in good faith, but longer-term targets for valuation may be uncertain. One cannot invest directly in an index.
- After the recent backup in yields, valuations appear relatively fair across the fixed income landscape.
- There may be opportunities within investment-grade municipal bonds, as yields have risen above fair value estimates due to robust new issuance to start the year.
This material is intended to review matters of possible interest to Glenmede Trust Company clients and friends and is not intended as personalized investment advice. When provided to a client, advice is based on the client’s unique circumstances and may differ substantially from any general recommendations, suggestions or other considerations included in this material. Any opinions, recommendations, expectations or projections herein are based on information available at the time of publication and may change thereafter. Information obtained from third-party sources is assumed to be reliable but may not be independently verified, and the accuracy thereof is not guaranteed. Outcomes (including performance) may differ materially from any expectations and projections noted herein due to various risks and uncertainties. Any reference to risk management or risk control does not imply that risk can be eliminated. All investments have risk. Clients are encouraged to discuss any matter discussed herein with their Glenmede representative.

Feature one
Use text and images to tell your company’s story. Explain what makes your product or service extraordinary.

Feature two
Use text and images to tell your company’s story. Explain what makes your product or service extraordinary.

Feature three
Use text and images to tell your company’s story. Explain what makes your product or service extraordinary.

