Investment Strategy Brief
Stuck in Government
Shutdown Mode
October 12, 2025

Executive Summary
- The federal government shutdown continues for a second week amid a failure to negotiate a funding bill.
- Shutdowns typically have a modest economic impact but could become significant if they persist.
- There is not a consistent pattern of material market weakness around historical government shutdowns.
- With no Consumer Price Index (CPI) data this week, surveys suggest inflation may rise as firms pass more tariff costs to consumers.
- While the shutdown’s near-term impact is growing, investors should focus on the long-term and maintain current portfolio positioning.
During a shutdown, most federal workers are furloughed while some services may be limited
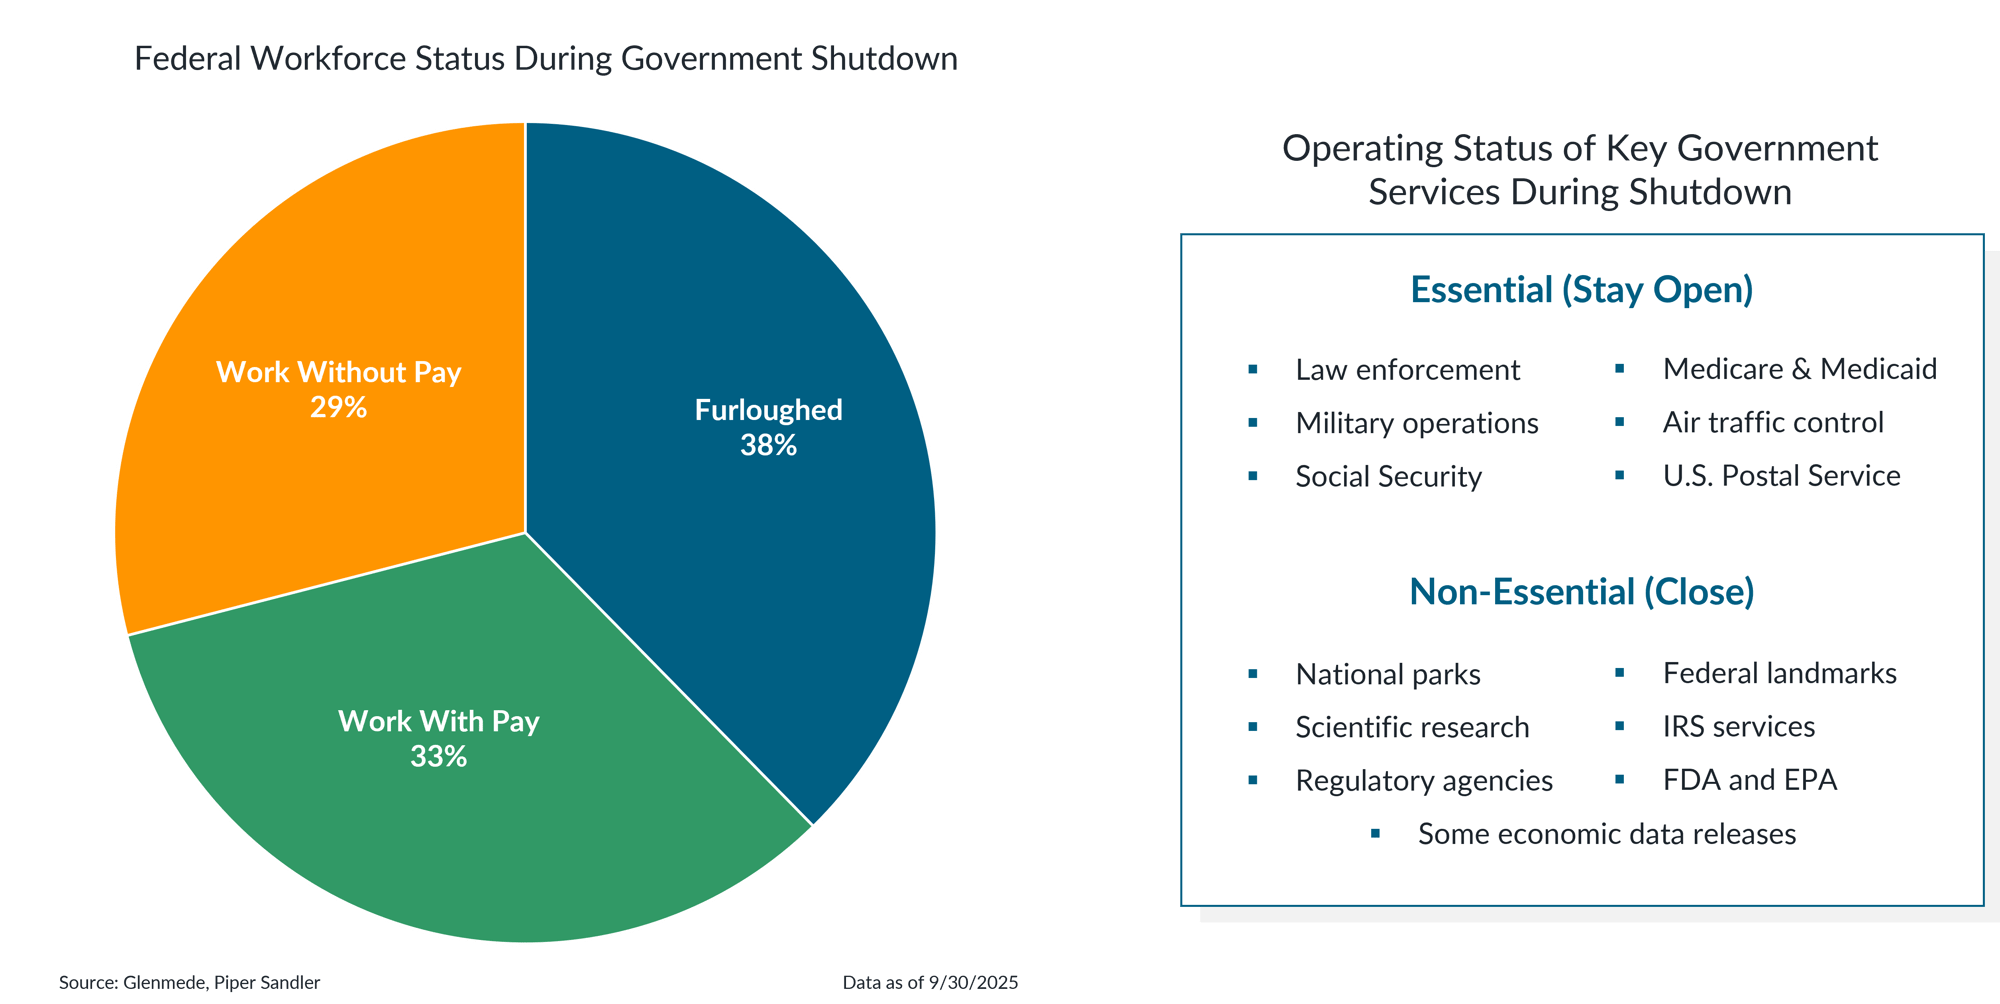
Shown in the left panel is the distribution of federal employees that are required to work without immediate pay, those who continue working with pay, and those furloughed or temporarily relieved from duty during a government shutdown. Shown in the right panel is a general overview of public services that remain operational, and which are suspended or closed in the event of a shutdown. IRS refers to the Internal Revenue Service. FDA refers to the Food & Drug Administration. EPA refers to the Environmental Protection Agency.
- During shutdowns, roughly one-third of workers continue to work with pay while the rest either work without pay or are furloughed entirely.
- The shutdown has suspended several non-essential government functions, including some economic data releases, introducing additional uncertainty into near-term analysis.
Government shutdowns have typically been resolved before having a material impact on the economy
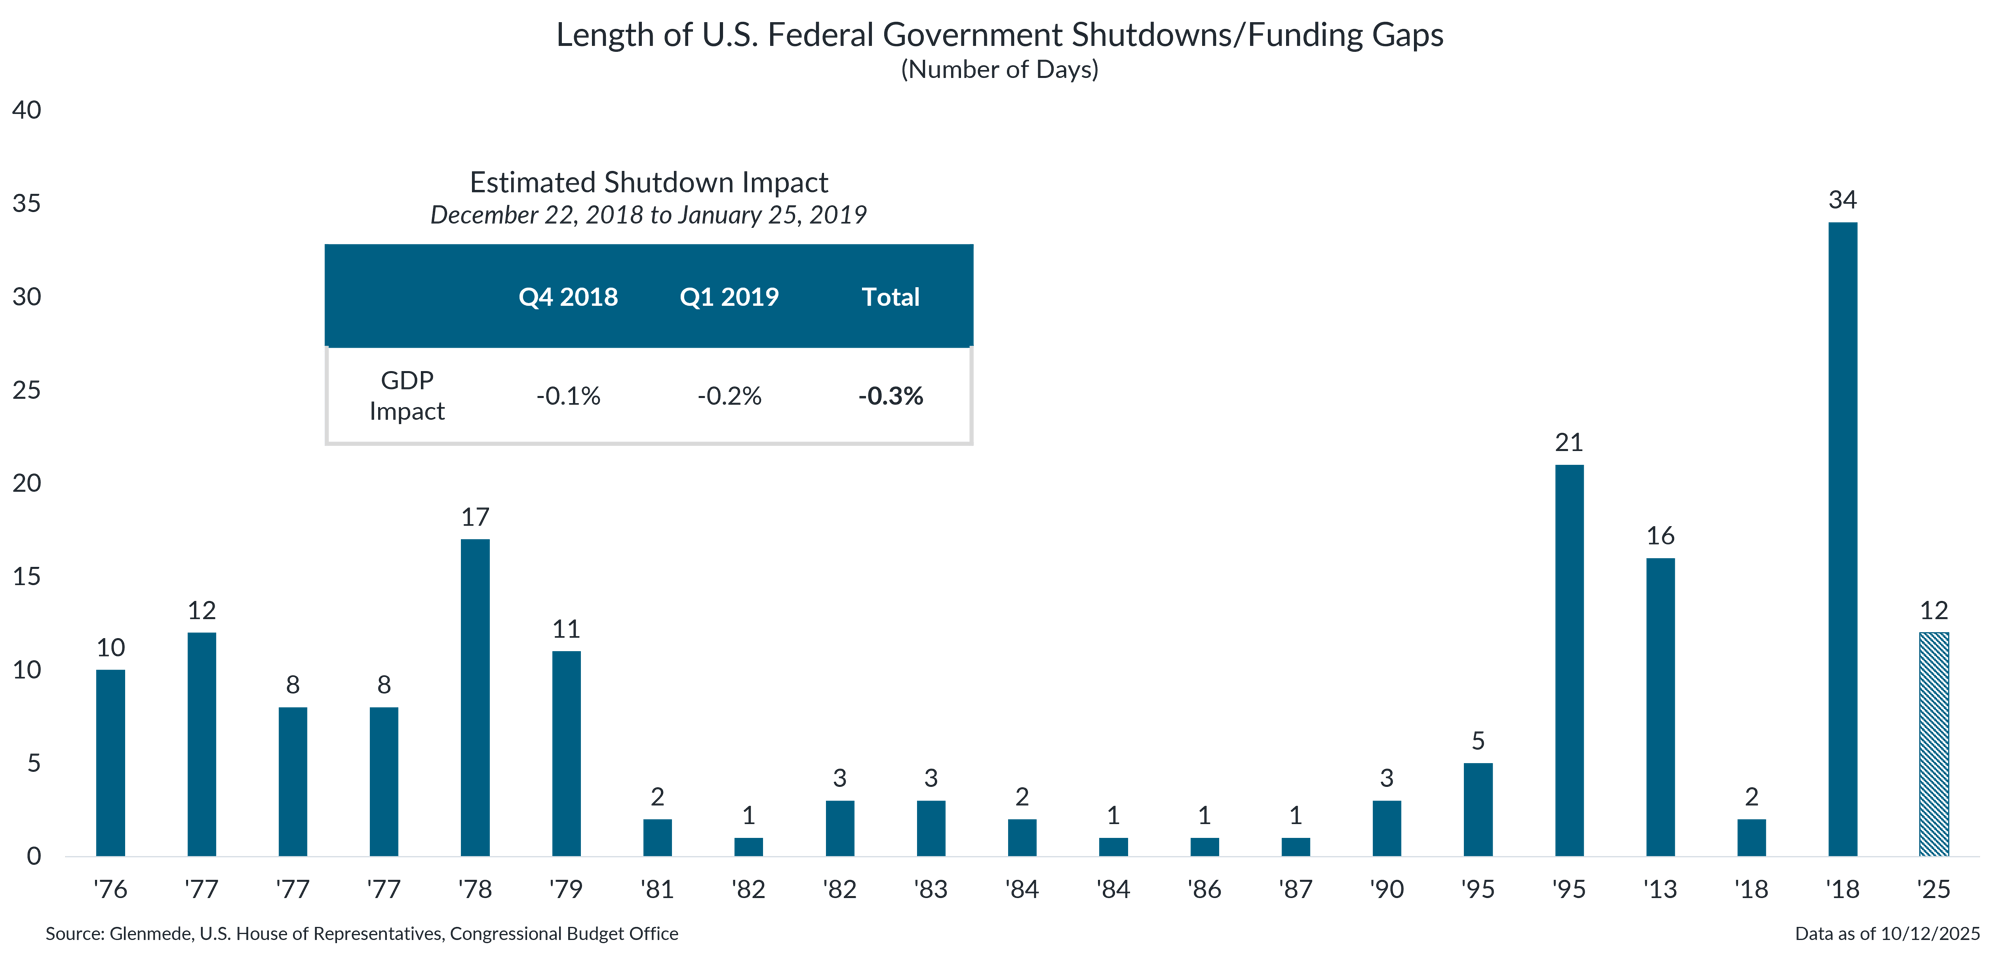
Shown is the cumulative duration of each U.S. federal government shutdown since 1976, measured in number of days. Each shutdown is labeled by the year in which it began, though some shutdowns spanned multiple years. For example, the shutdown that started in 2018 but extended into 2019 is denoted as ’18. The hashed bar for ’25 denotes the ongoing nature of the shutdown. Shown in the table are estimates of the effect on real gross domestic product (GDP) from the last government shutdown. Real GDP measures the total increase in a country’s inflation-adjusted output of goods and services. Past performance may not be indicative of future results.
- Shutdown durations have varied widely, with most lasting only a few days, but several prolonged periods, notably in 1995 and 2018, resulted in multi-week disruptions to federal operations.
- Longer shutdowns have resulted in more notable economic effects, such as the 0.3% reduction in GDP during the 2018 shutdown—but experienced similarly sized recoveries once they ended.
The near-term economic impact of the shutdown may become more apparent as it extends into its second week
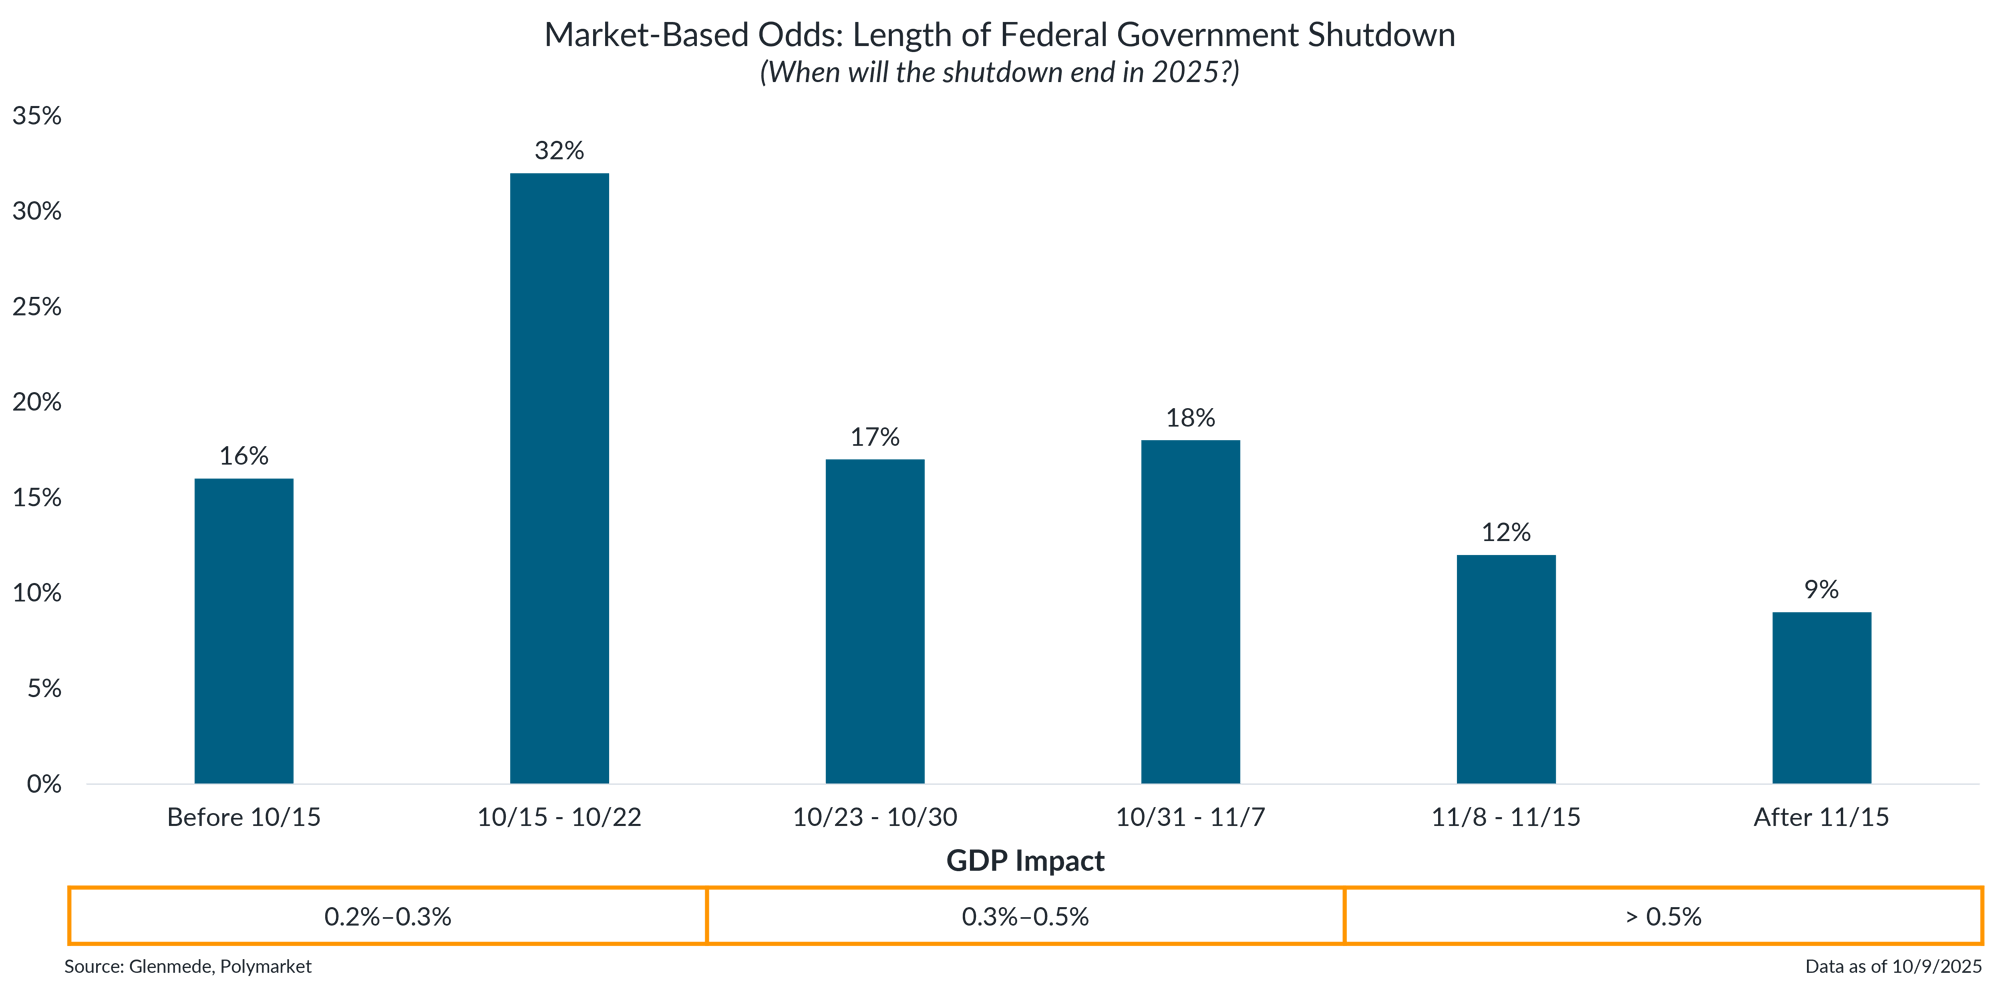
Data shown are market-based odds of the length of the government shut down in 2025 via Polymarket. Polymarket is a prediction market where investors can place bets on various future events. References to Polymarket and use of its data herein should in no way be interpreted as an endorsement or recommendation of Polymarket by Glenmede. Probabilities or likelihoods shown are not the opinions of Glenmede and are shown for illustrative purposes only. Actual results may differ materially from probabilities shown, particularly for prediction markets with low trading volume.
- Markets currently assign the highest probability to the shutdown ending between October 15 and 22, though expectations remain broadly distributed across later dates, reflecting continued uncertainty around its duration.
- With the shutdown nearing its second week, the near-term economic headwind has risen to ~0.2% of GDP, with the potential to grow larger if the shutdown persists.
There is not a consistent pattern of material market weakness around historical government shutdowns
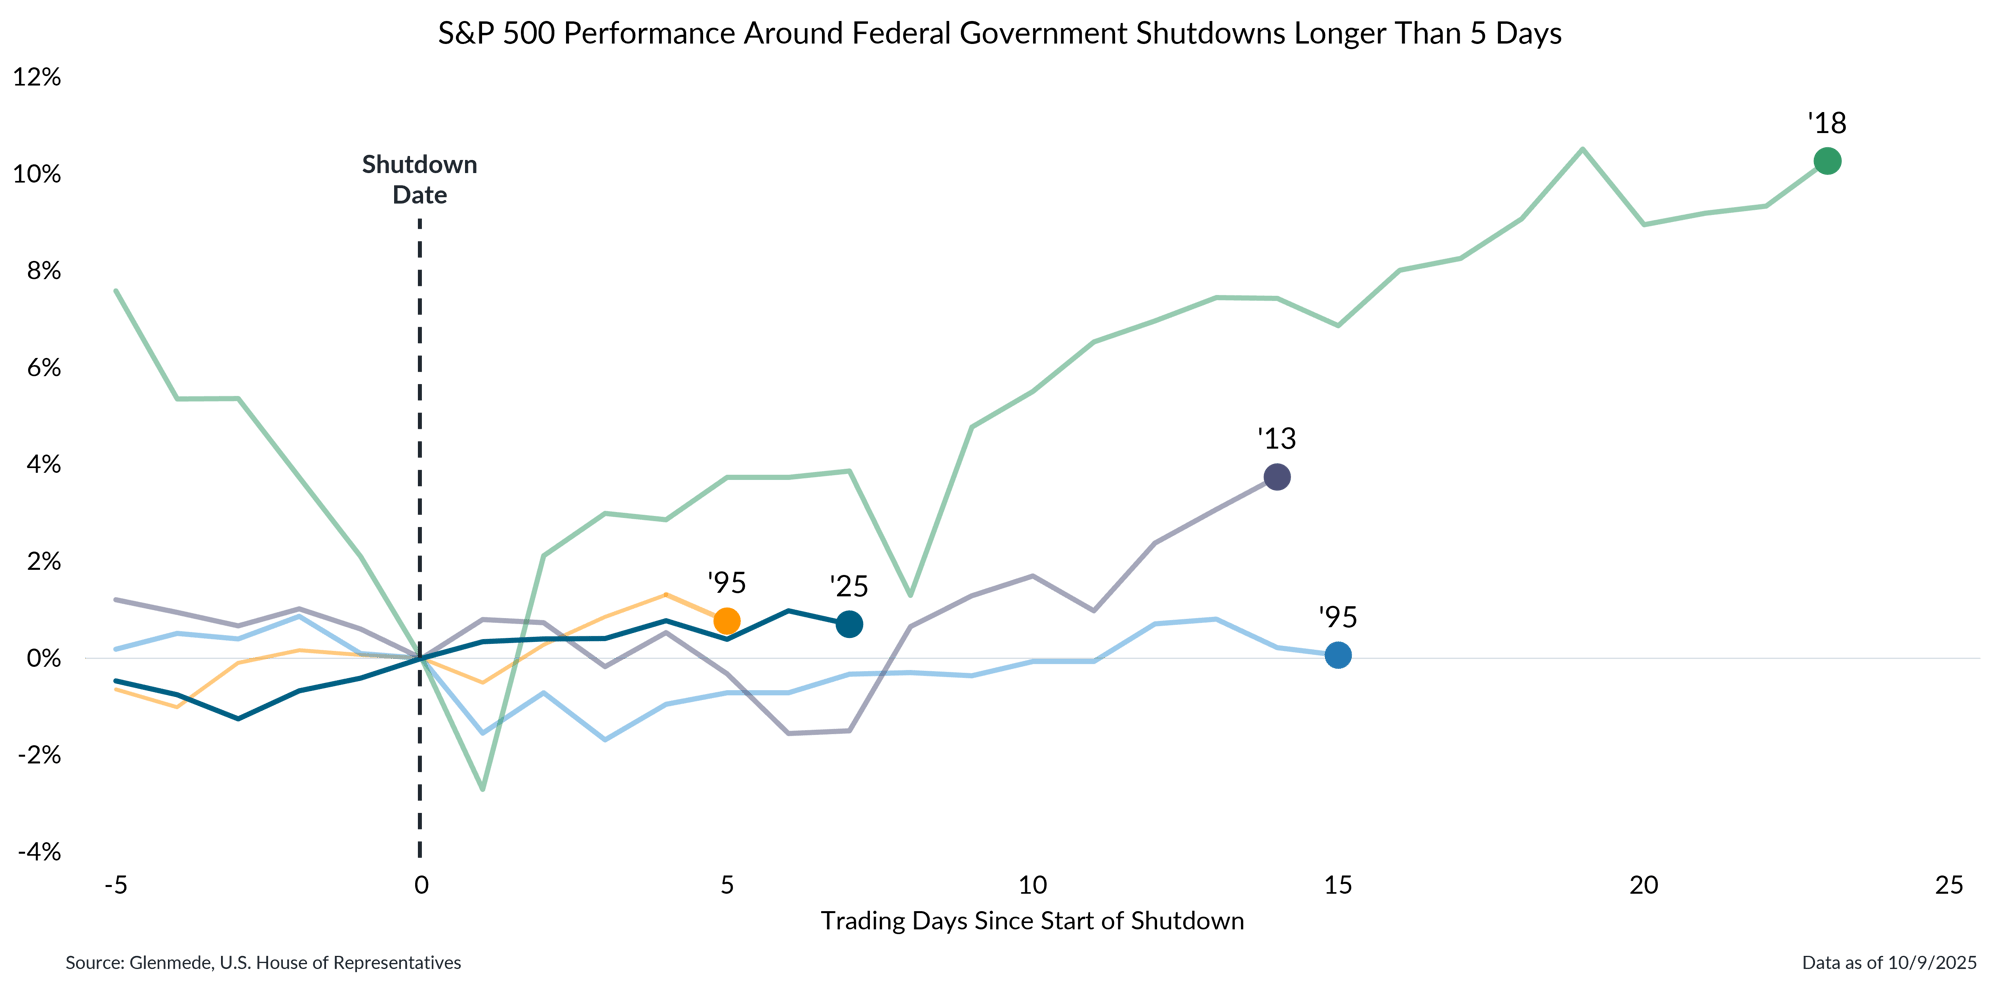
Data shown represent the price performance of the S&P 500 during the trading days before and after federal government shutdowns that lasted longer than five days, with each line ending when the government reopened. Federal government funding lapses that did not result in shutdown procedures are excluded from the dataset. The S&P 500 is a market capitalization weighted index of large cap stocks in the U.S. Past performance may not be indicative of future results. One cannot invest directly in an index.
- Investors appear to have historically looked through such events, expecting either quick resolution or recognizing that the economy would recover any shutdown-related losses.
- The 2018 shutdown contributed to the sharp market decline around Christmas that year but was one of many factors that created the perfect storm of events behind that selloff.
With no CPI data this week, surveys suggest inflation may rise as firms pass more tariff costs to consumers
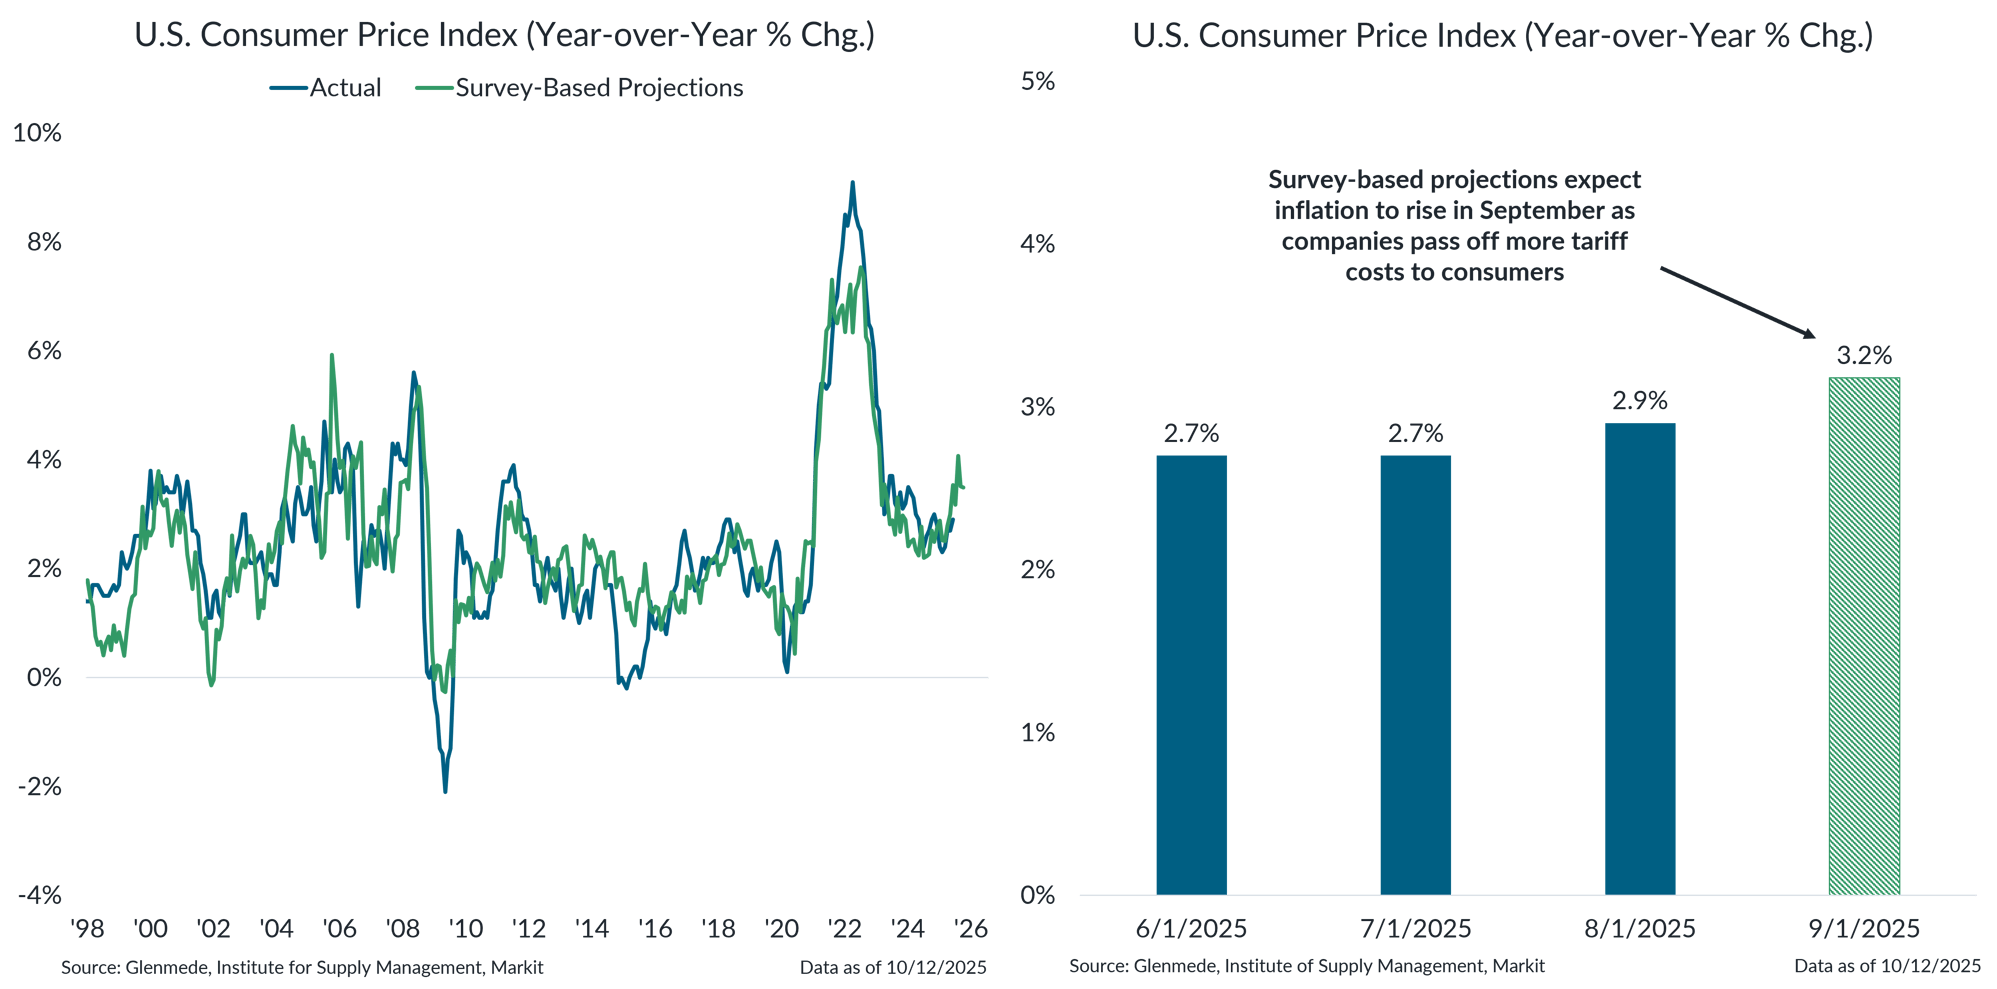
Data shown on the left in blue represent the year-over-year percent change in the U.S. CPI; in green is the output of a prediction model based on the input/output price components of purchasing managers’ indexes. Data shown on the right represent the last few months of the CPI’s annual run rate in solid blue, including projections for September based on the output of the prediction model in hashed green. Actual results may differ materially from projections.
- While not perfect, survey-based inflation projections have generally tracked closely with official CPI readings, serving as a useful real-time indicator of inflation in the absence of new CPI data this week.
- The latest survey-based projections suggest inflation may rise to 3.2% year-over-year in September, consistent with expectations that companies will pass more tariff-related costs on to consumers.
This material is provided solely for informational and/or educational purposes and is not intended as personalized investment advice. When provided to a client, advice is based on the client’s unique circumstances and may differ substantially from any general recommendations, suggestions or other considerations included in this material. Any opinions, recommendations, expectations or projections herein are based on information available at the time of publication and may change thereafter. Information obtained from third-party sources is assumed to be reliable but may not be independently verified, and the accuracy thereof is not guaranteed. Any company, fund or security referenced herein is provided solely for illustrative purposes and should not be construed as a recommendation to buy, hold or sell it. Outcomes (including performance) may differ materially from any expectations and projections noted herein due to various risks and uncertainties. Any reference to risk management or risk control does not imply that risk can be eliminated. All investments have risk. Clients are encouraged to discuss any matter discussed herein with their Glenmede representative.

