Investment Strategy & Research
The Consumption Conundrum
May 26, 2024

Executive Summary
- Consumers have been behaving differently than surveys would suggest, maintaining consumption patterns alongside downbeat economic assessments.
- Household net worth for the bottom 90% has recently caught up, resulting in a wealth effect tailwind.
- A portion of consumers face difficulty with credit card debt, but aggregate debt burdens are contained.
- The average consumer has remained unusually resilient through a tough period, contributing to a more balanced economic outlook.
Consumers have been behaving differently than surveys would suggest
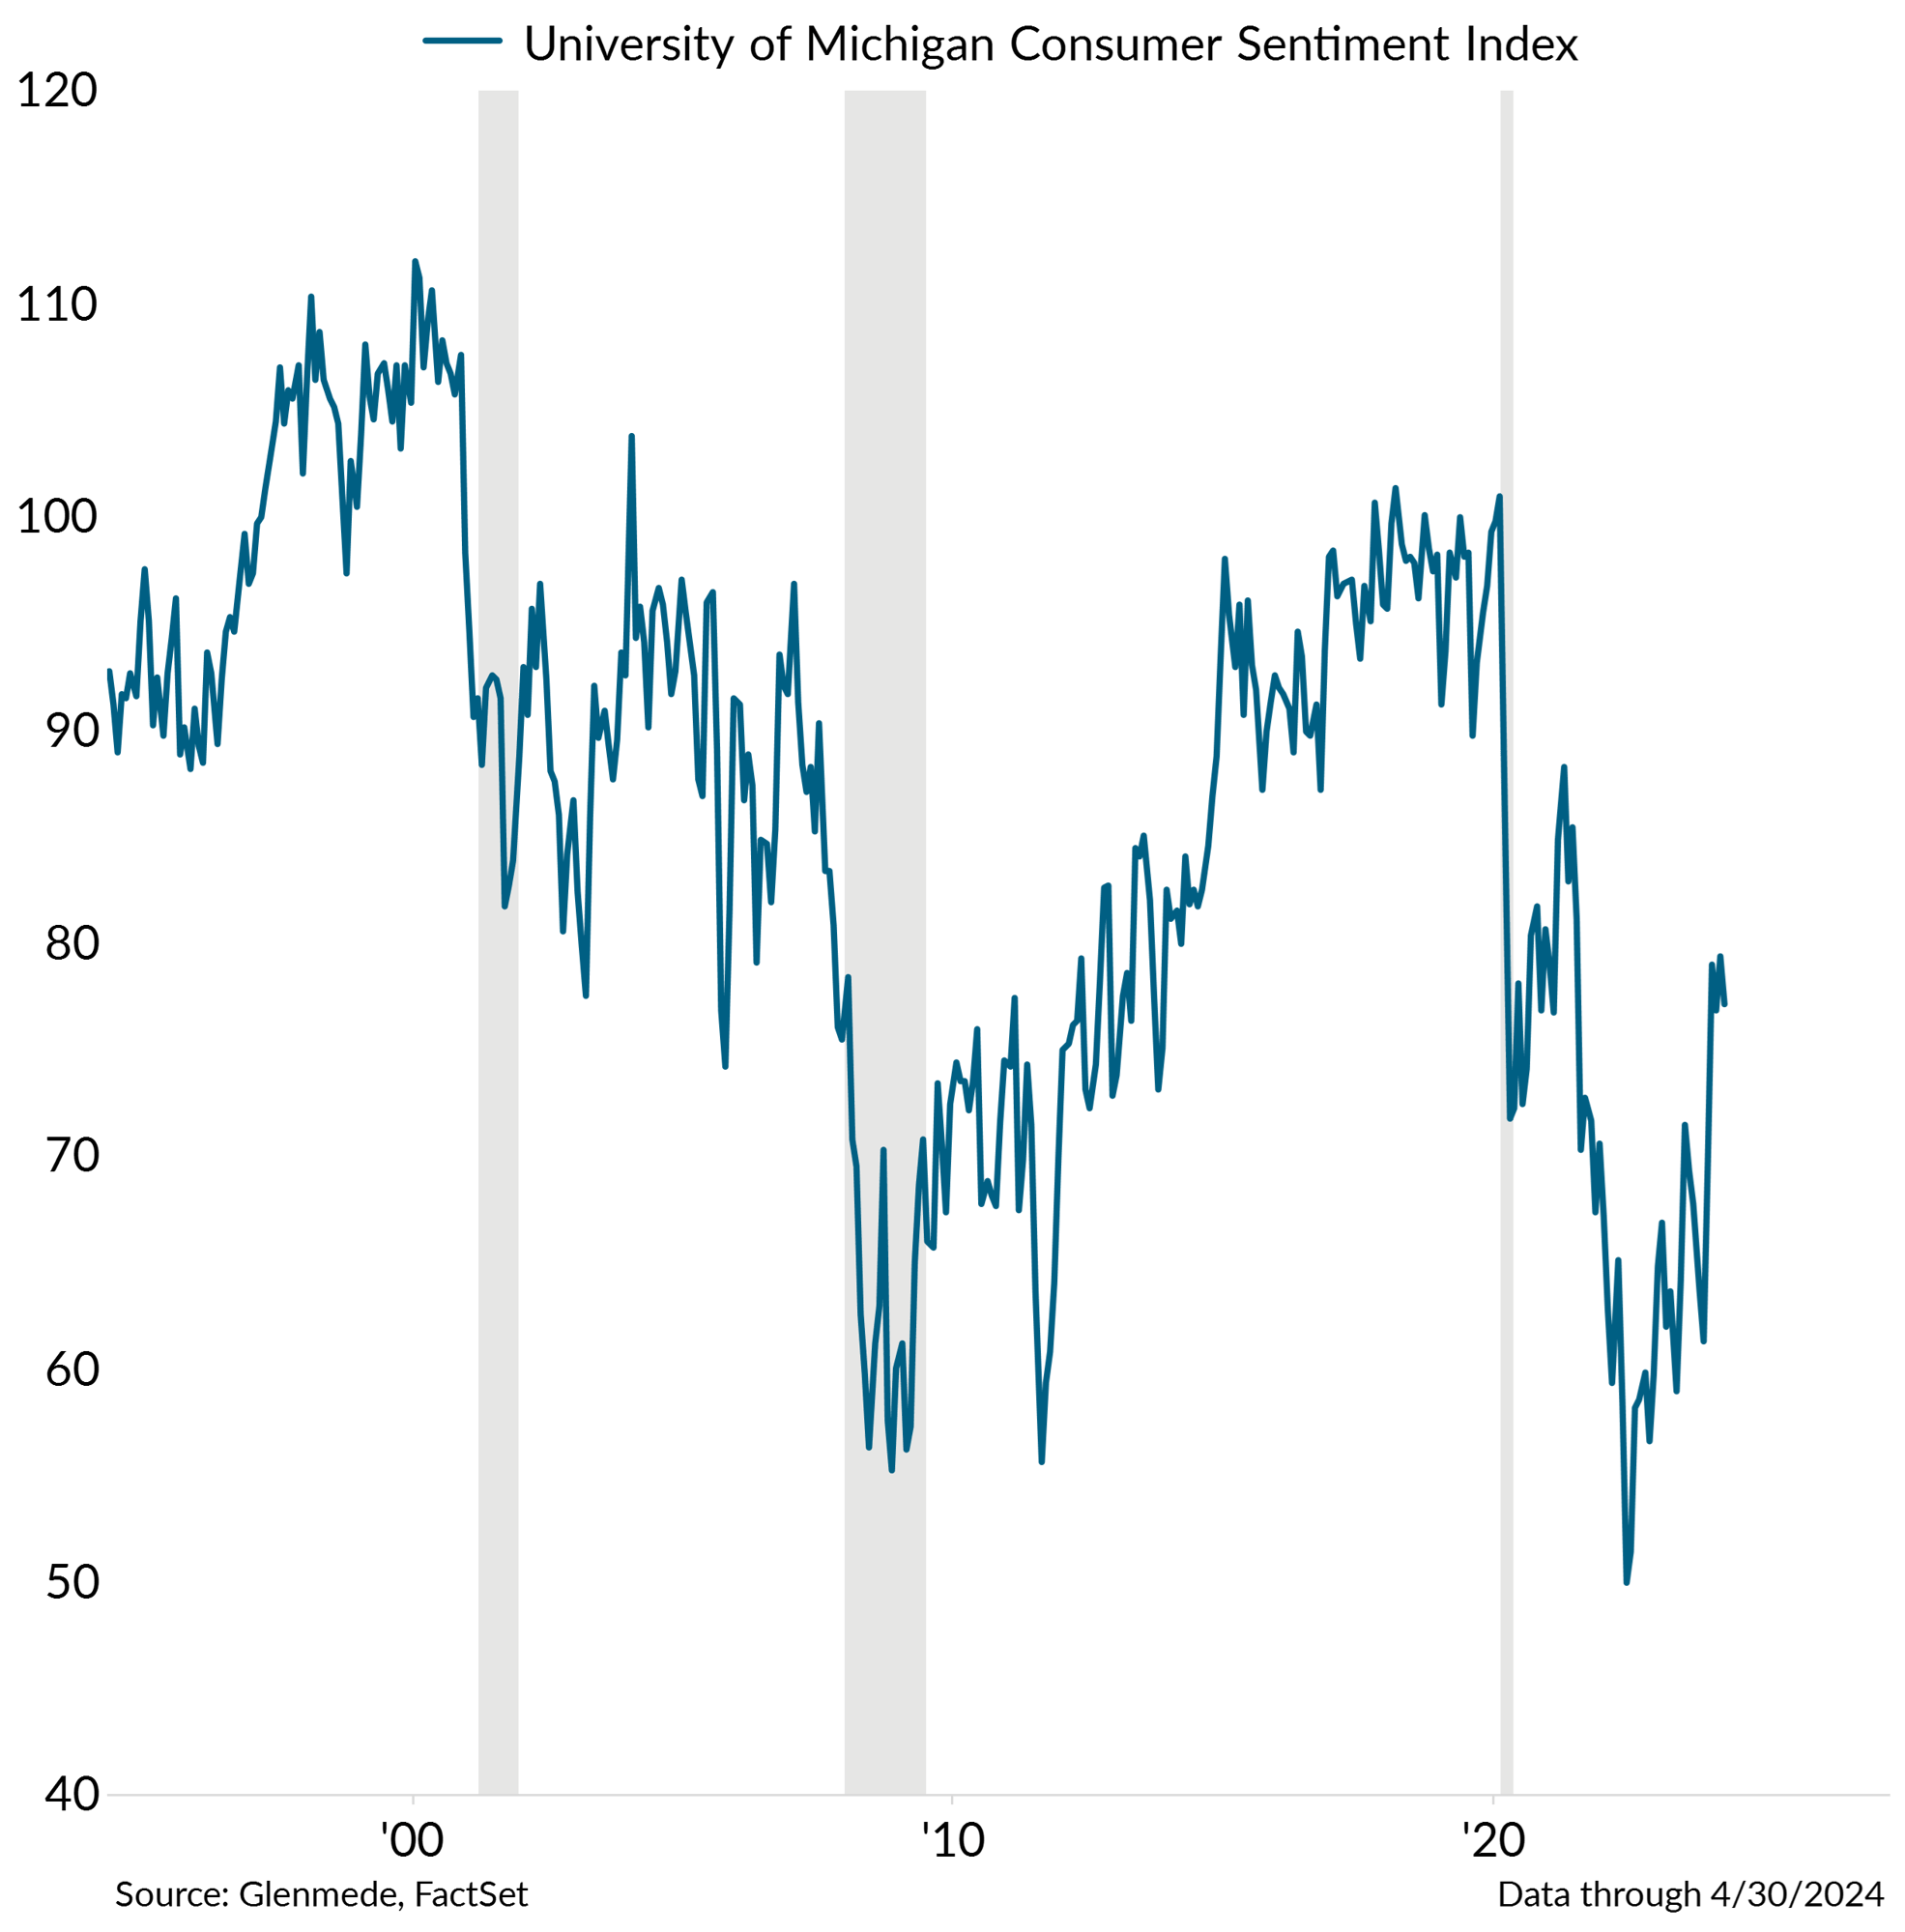
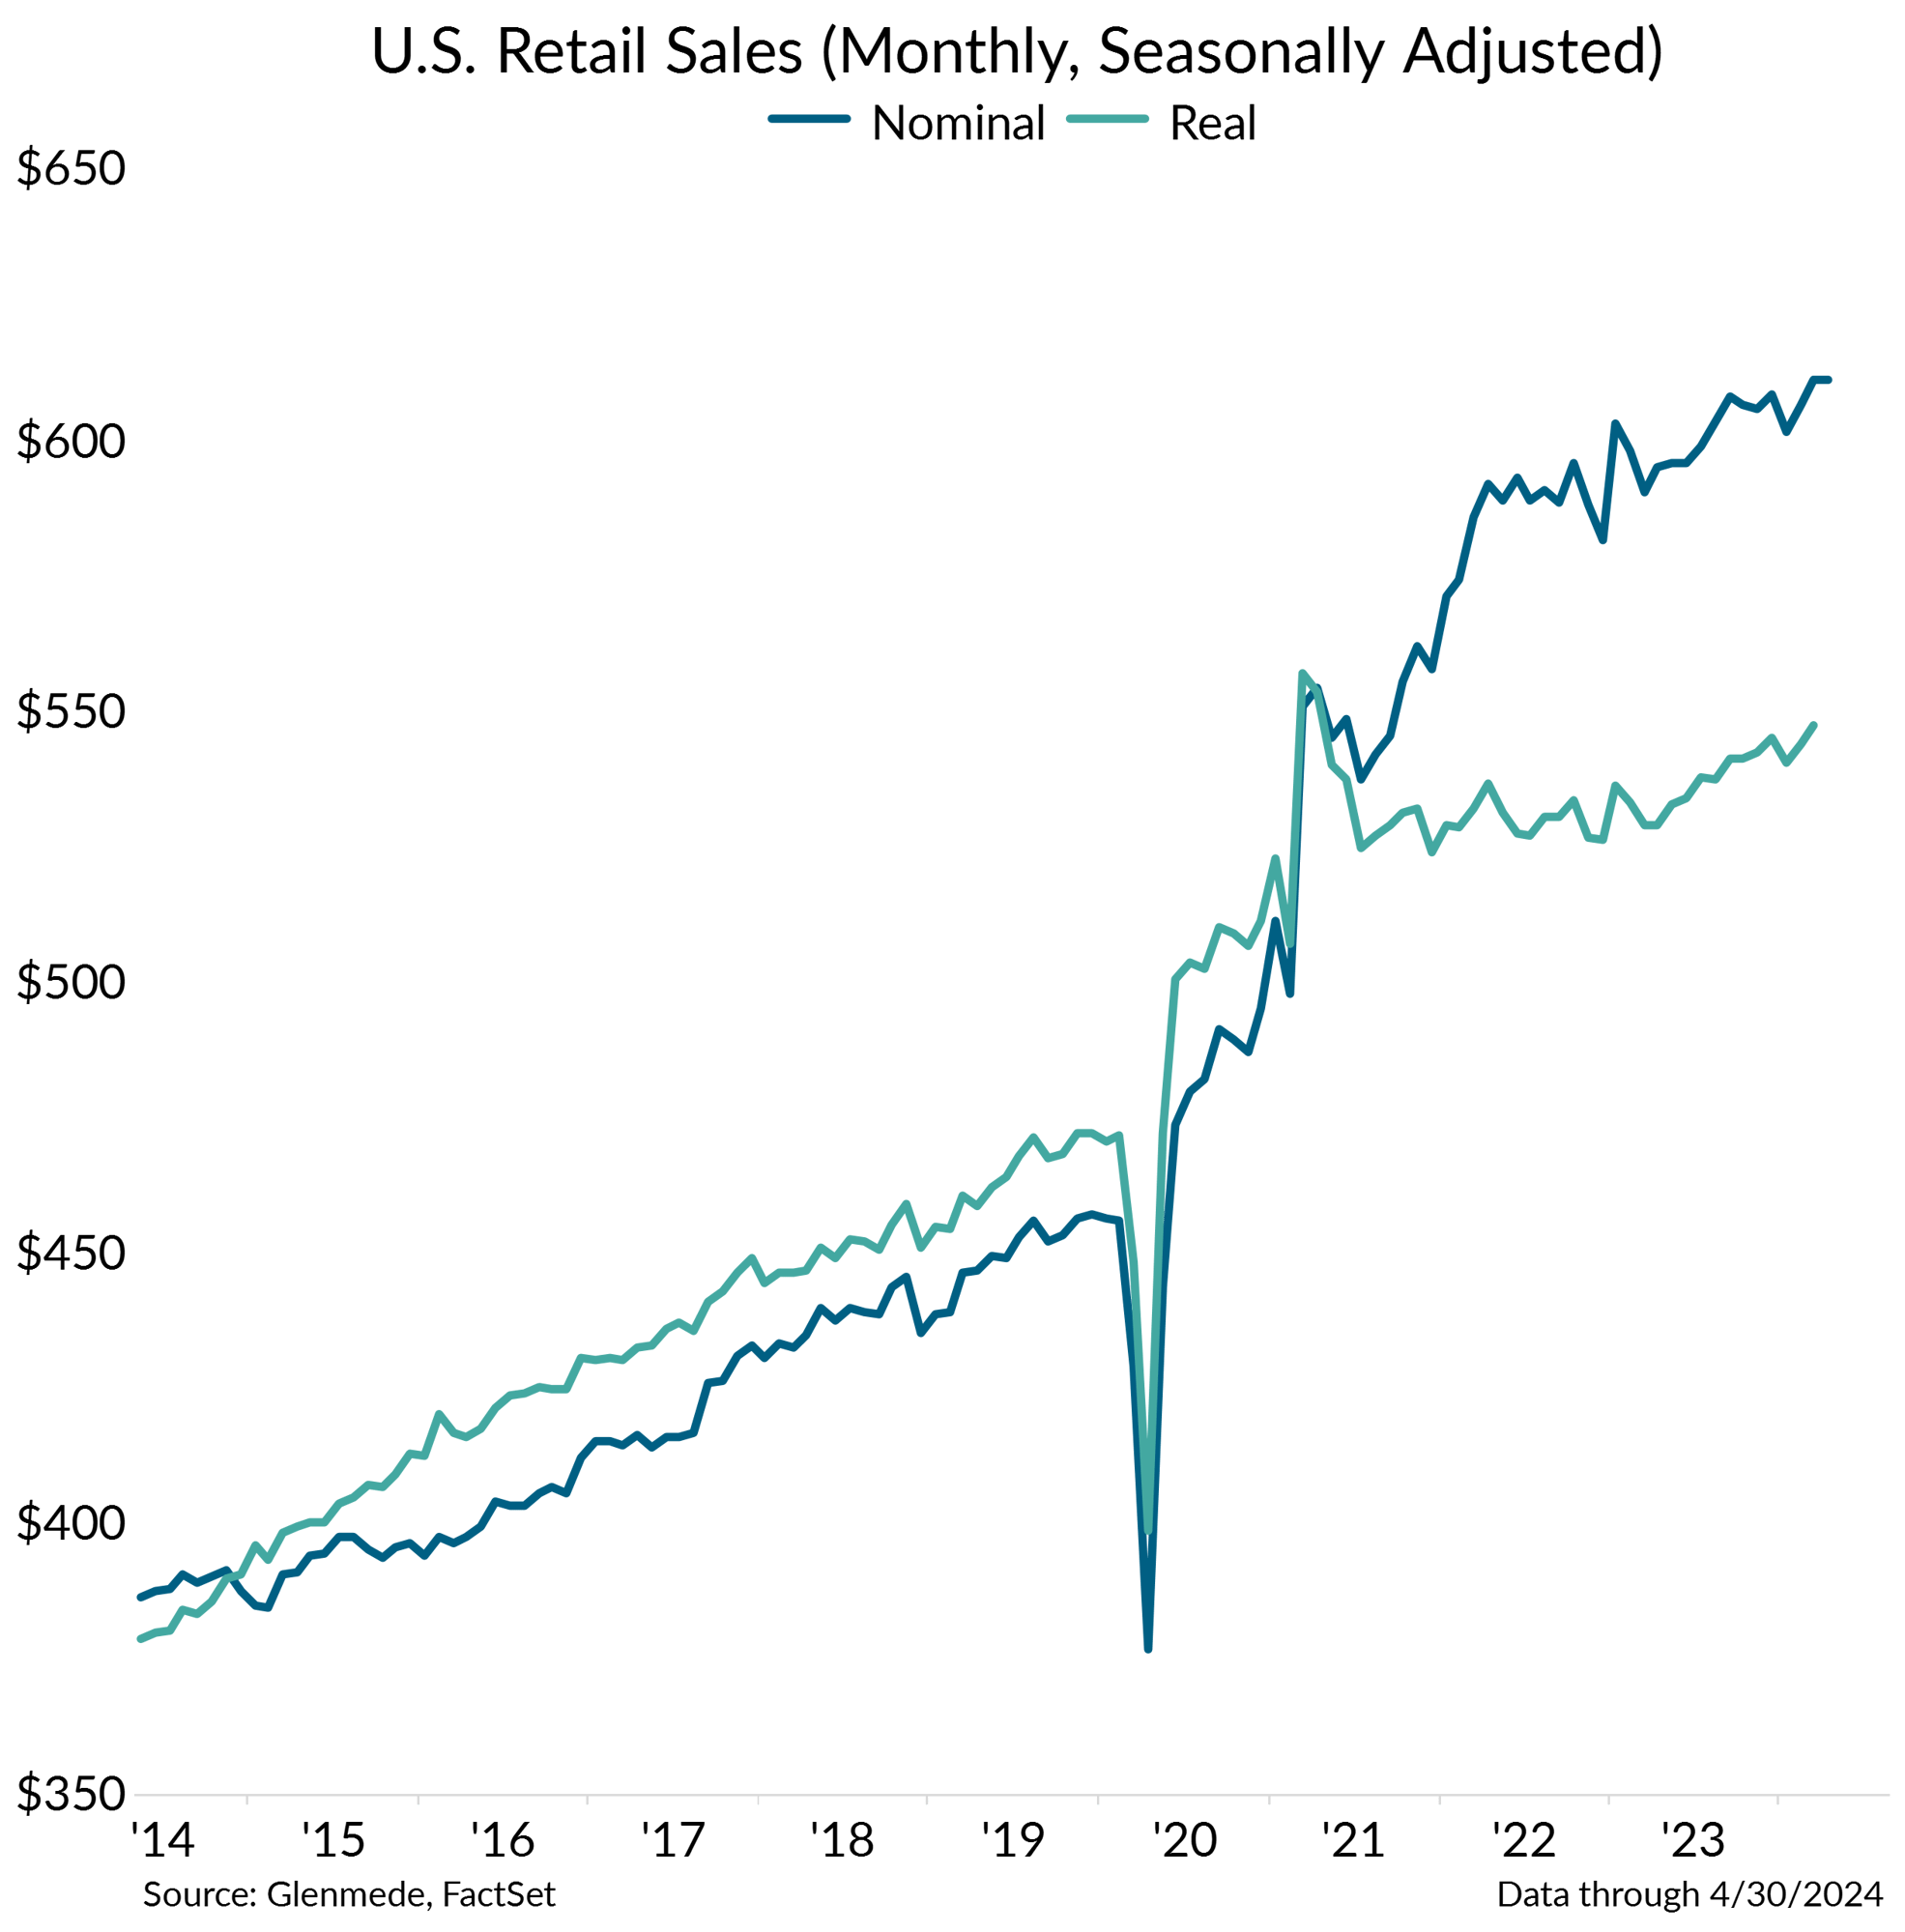
Data shown in the left panel is the University of Michigan’s Consumer Sentiment Index. Data shown in the right panel is U.S. monthly retail sales in billions of U.S. dollars and seasonally adjusted. The blue line represents nominal figures and the green line represents inflation-adjusted figures, based on chained 2017 price levels.
- The University of Michigan’s Consumer Sentiment Index has remained in territory historically consistent with recession.
- However, consumers have been saying one thing to survey pollsters and doing another with their wallets, maintaining healthy consumption patterns on a nominal and real basis.
Household net worth for the bottom 90% has recently caught up, a wealth effect tailwind
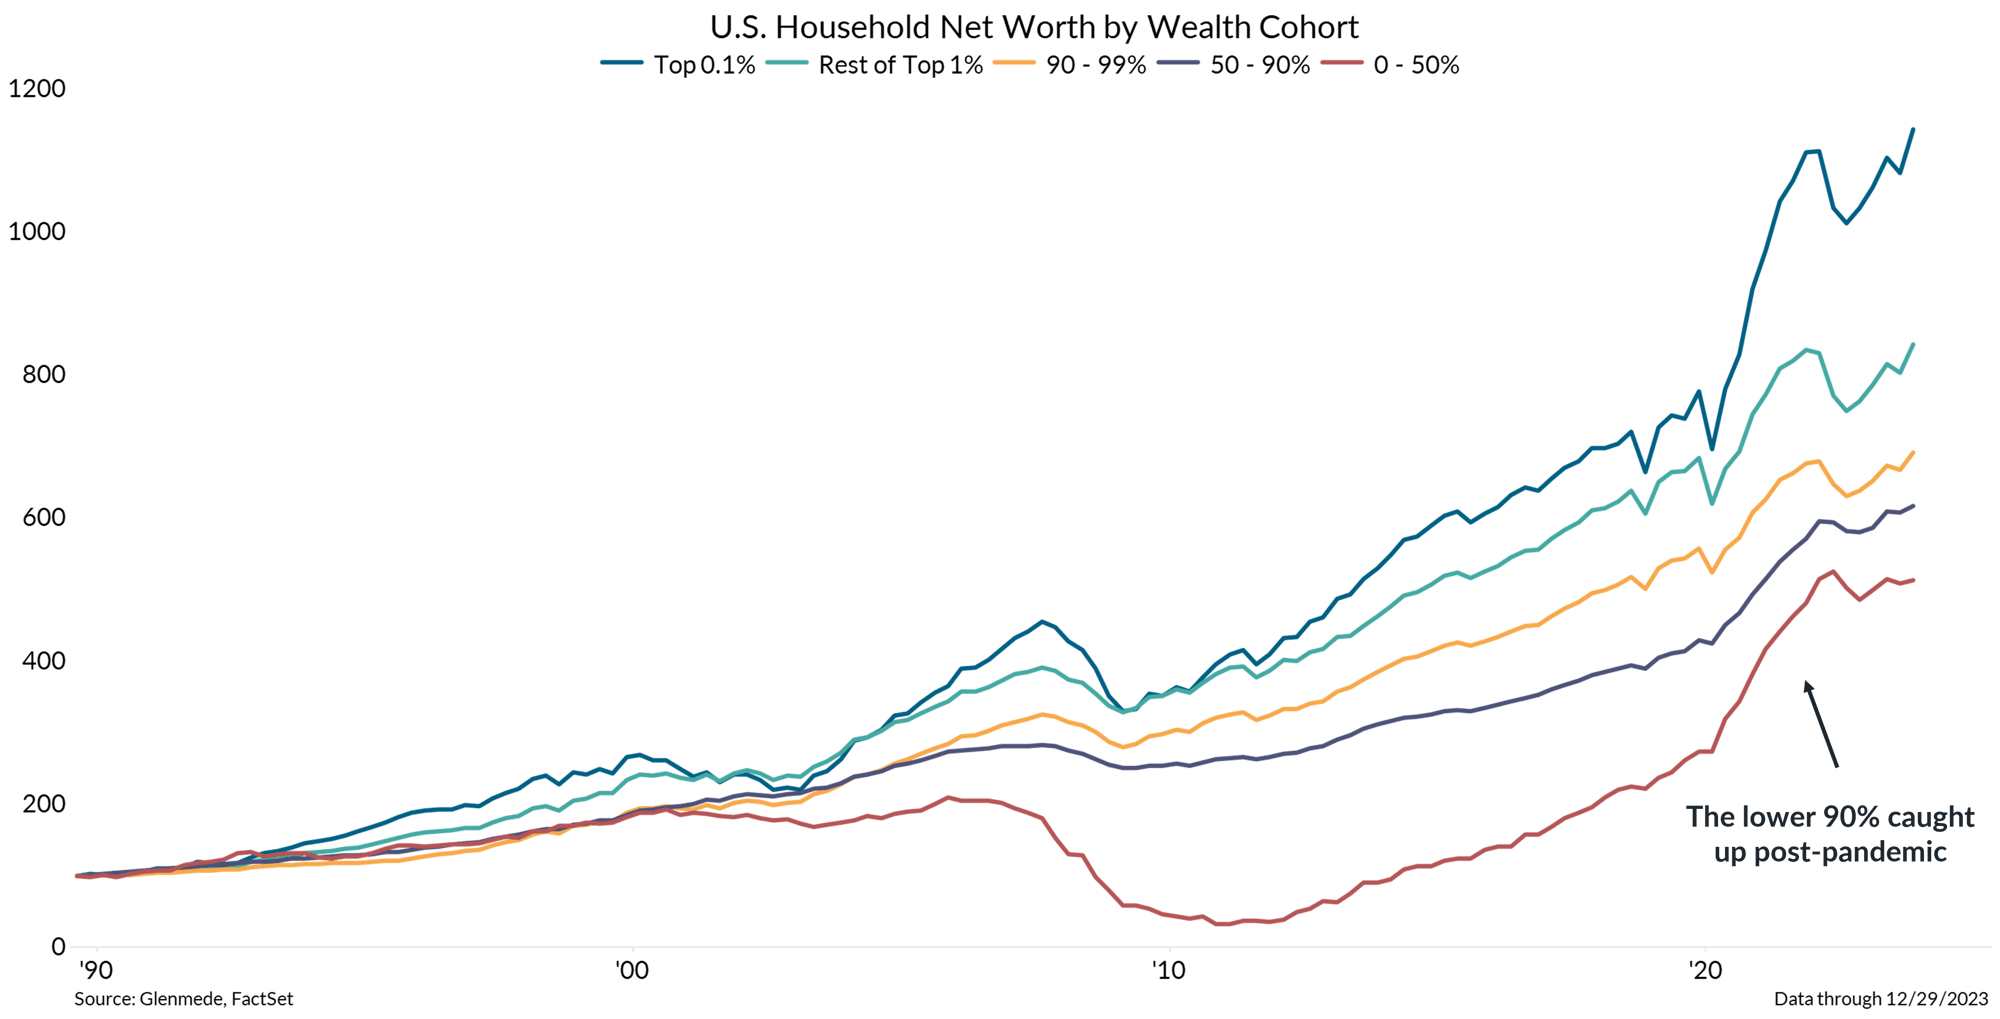
Data shown are U.S. household net worth figures for various wealth cohorts represented by percentile ranges, indexed to 100 on 9/30/1989.
- More households have participated in net worth improvements post-COVID as participation in markets has increased and home equity values have risen.
- The wealth effect, when people spend more as their perceived level of wealth increases, may be a tailwind for consumption from the lower end of wealth cohorts.
Credit card debt trends look troublesome, but aggregate debt burdens are contained
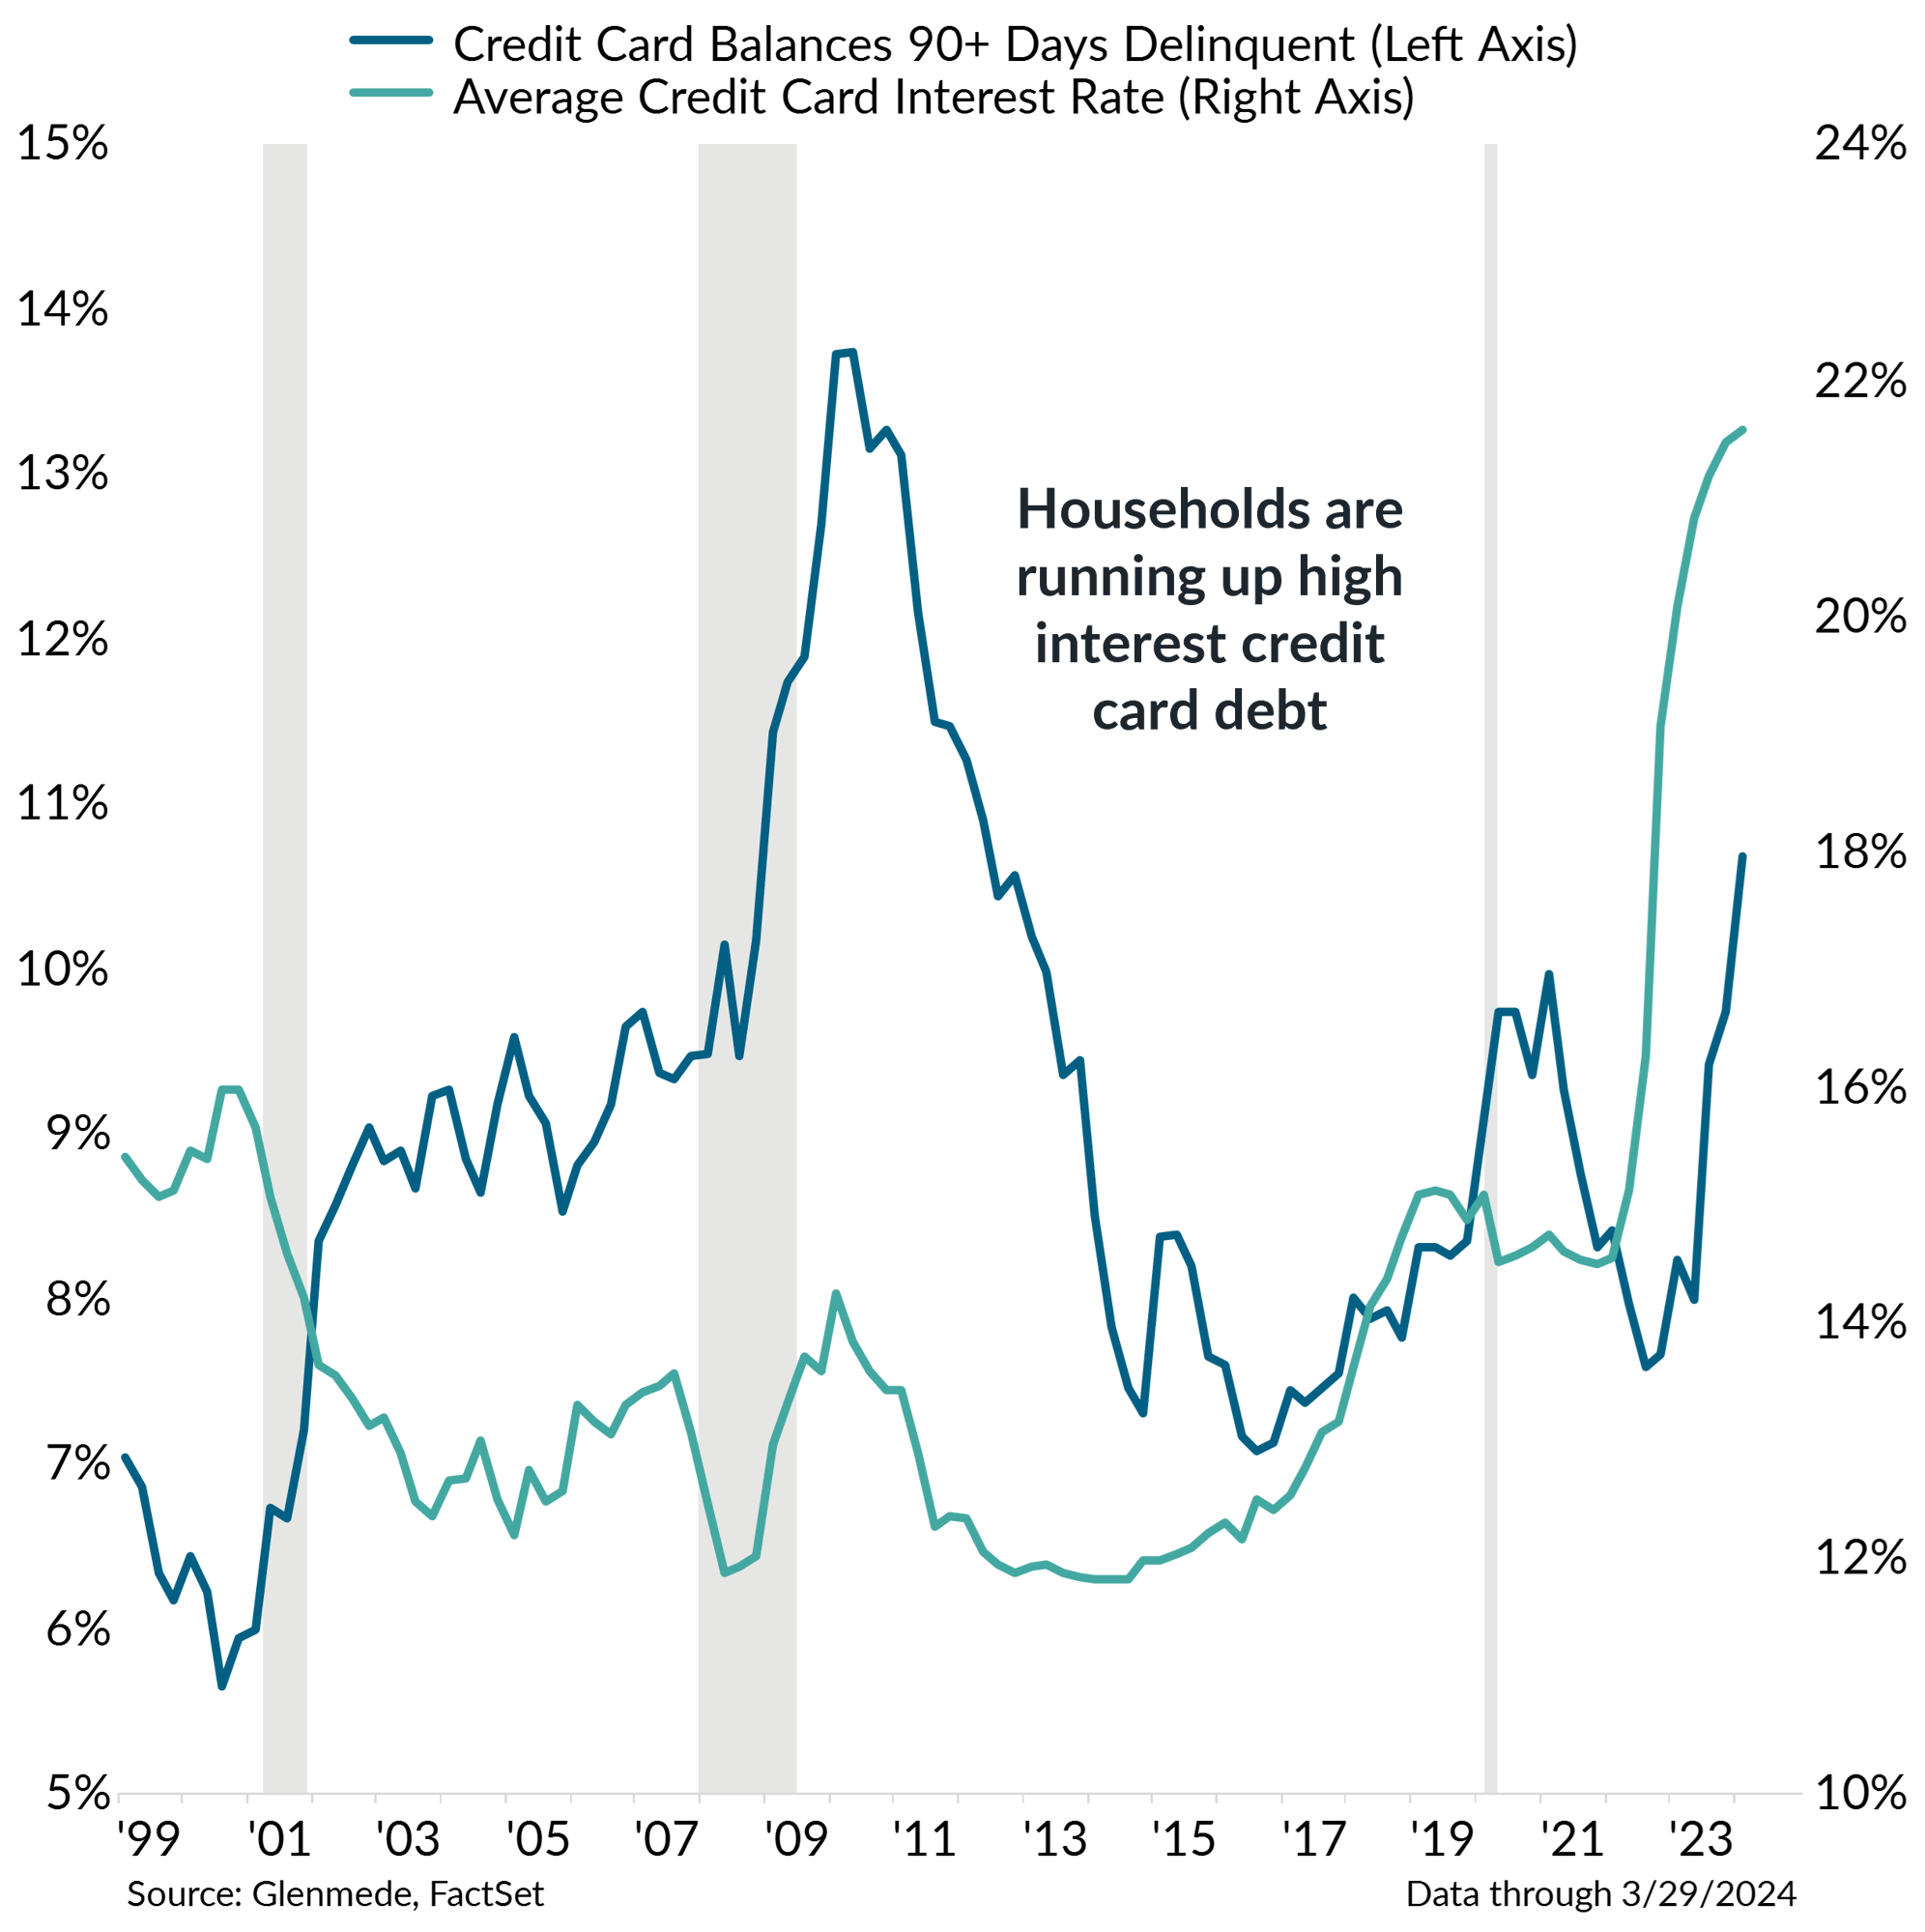
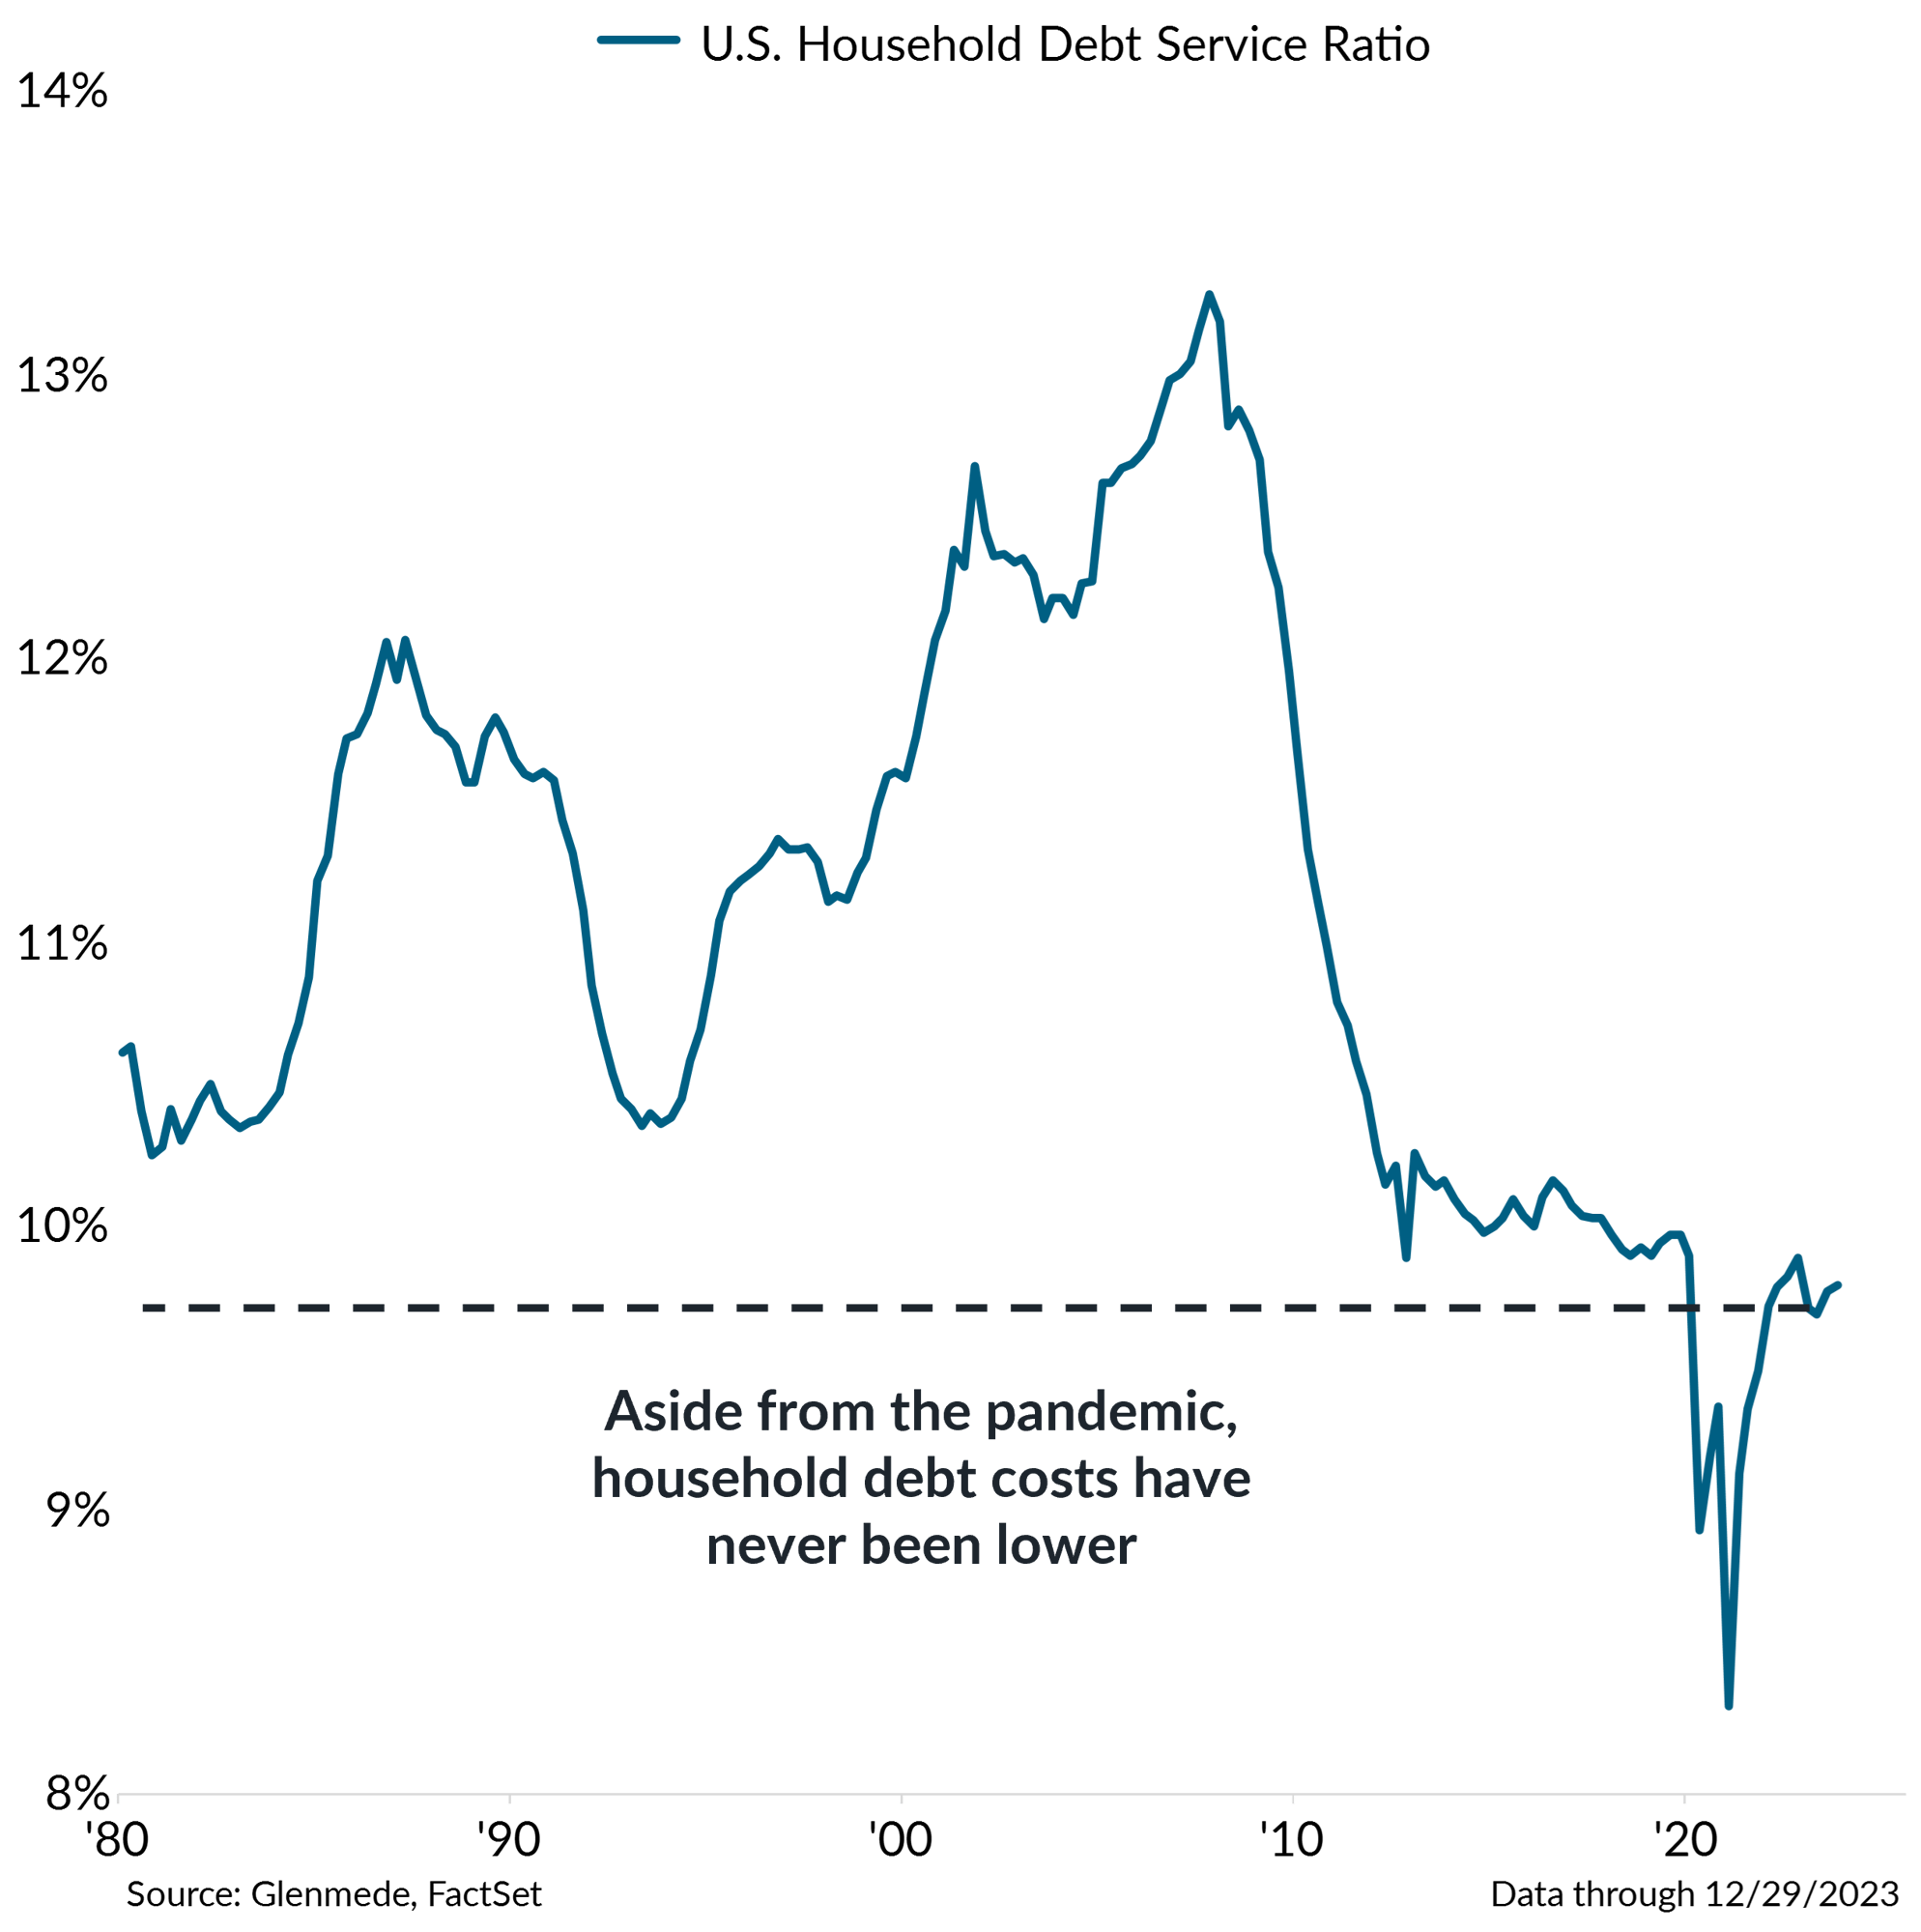
Data shown in the left panel are the share of credit card balances 90 days or more delinquent (graphed along the left y-axis) and the average interest rate on credit card balances (graphed along the right y-axis). Data shown the right panel are the sum of mortgage and other consumer debt, divided by disposable personal income. Gray-shaded regions represent periods of recession in the U.S.
- The share of credit card balances more than 90 days delinquent has been on the rise just as interest rates on that debt have been at multi-decade highs.
- However, aside from pandemic extremes, the household debt service costs (i.e., interest on debt as a share of disposable incomes) has never been lower.
For more in-depth information on this topic, please reach out to your Glenmede Relationship Manager.
This material is intended to review matters of possible interest to Glenmede Trust Company clients and friends and is not intended as personalized investment advice. When provided to a client, advice is based on the client’s unique circumstances and may differ substantially from any general recommendations, suggestions or other considerations included in this material. Any opinions, recommendations, expectations or projections herein are based on information available at the time of publication and may change thereafter. Information obtained from third-party sources is assumed to be reliable but may not be independently verified, and the accuracy thereof is not guaranteed. Outcomes (including performance) may differ materially from any expectations and projections noted herein due to various risks and uncertainties. Any reference to risk management or risk control does not imply that risk can be eliminated. All investments have risk. Clients are encouraged to discuss any matter discussed herein with their Glenmede representative.

Feature one
Use text and images to tell your company’s story. Explain what makes your product or service extraordinary.

Feature two
Use text and images to tell your company’s story. Explain what makes your product or service extraordinary.

Feature three
Use text and images to tell your company’s story. Explain what makes your product or service extraordinary.
