

Investment Strategy Brief | August 16, 2026
The Engines of Economic Resilience
Executive Summary
-
Trade-related noise appears to be masking a resilient underlying economic growth engine driven by businesses and consumers.
-
As the beneficiary of several economic tailwinds, consumer spending remains a key driver of growth.
-
Strong corporate profits have been a broad phenomenon that continues to support investment growth.
-
Recession risks remain contained, supporting a resilient economic growth outlook.
-
Investors should maintain a full allocation to risk assets, justified by the ongoing resilience of the U.S. economy and corporate profits.
Trade-related noise appears to be masking a resilient underlying economic growth engine
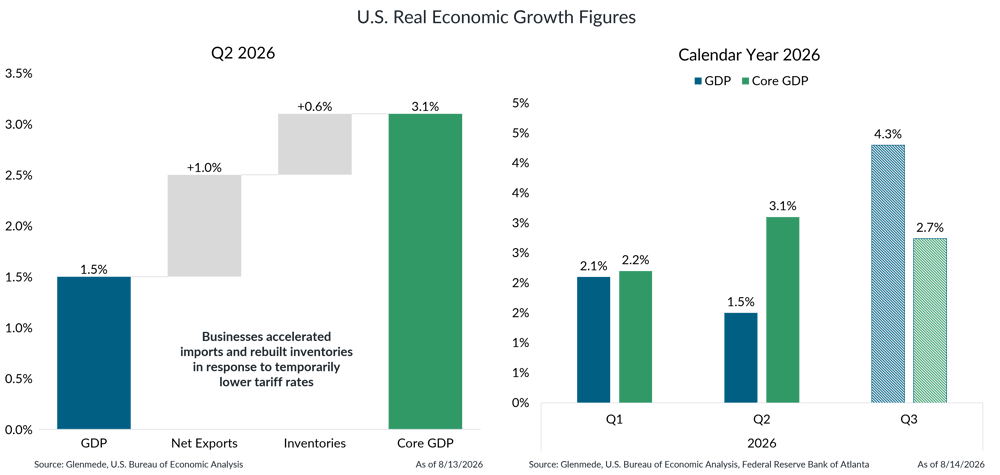
Shown on the left is the progression of calculations to reconcile gross domestic product (GDP) growth with Core GDP growth (which refers to final sales to domestic purchasers) in the U.S. for Q2 2026. Net exports refers to exports minus imports. Inventories refers to changes in private inventories. Shown on the right are the period-by-period GDP and Core GDP figures for calendar year 2026. All growth figures are shown as a seasonally adjusted, annualized, inflation-adjusted rate. Solid bars represent reported figures, and hashed bars represent projections. Actual results may differ materially from projections.
-
Economic activity in the U.S. has continued to expand this year despite headwinds from geopolitical uncertainty and tariffs, underscoring the resilience of the underlying economic foundation.
-
Headline GDP growth came in below expectations in both the first and second quarters, though this was largely a result of surging imports (which are subtracted from GDP figures). This may be a largely temporary headwind, as businesses pulled imports forward to take advantage of lower tariff rates before new trade measures took effect.
-
On the other hand, core measures of economic activity centered on consumer spending and business investment have remained resilient, supported by healthy household finances, strong corporate profitability, and a still-favorable backdrop for economic activity.
As the beneficiary of several economic tailwinds, consumer spending remains a key driver of growth
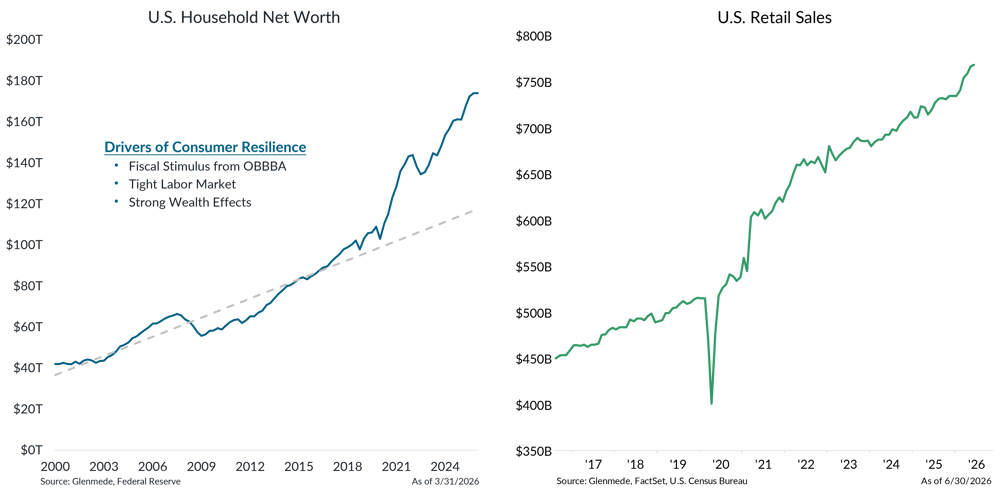
Shown on the left is U.S. household net worth, calculated as the value of household assets less liabilities, measured in trillions of U.S. dollars. Household assets include corporate equities, deposits and money market fund shares, owner-occupied real estate, and other financial and nonfinancial assets. The dashed gray line represents the long-term linear trend. Shown on the right are monthly U.S. retail sales, measured in billions of U.S. dollars on a seasonally adjusted basis. OBBBA refers to the One Big Beautiful Bill Act (2025).
-
Several factors continue to support consumer resilience, including recent fiscal stimulus from the One Big Beautiful Bill Act (OBBBA) and a labor market characterized by low unemployment.
-
In particular, the wealth effect may be playing a role, given the propensity of households to spend more when they feel wealthier. This has become particularly relevant amid the unrelenting bull market in equities.
-
Together, these tailwinds have supported resilient retail spending, reinforcing the consumer's role as the primary engine of U.S. economic growth.
Strong corporate profits have been a broad phenomenon that continues to support investment growth
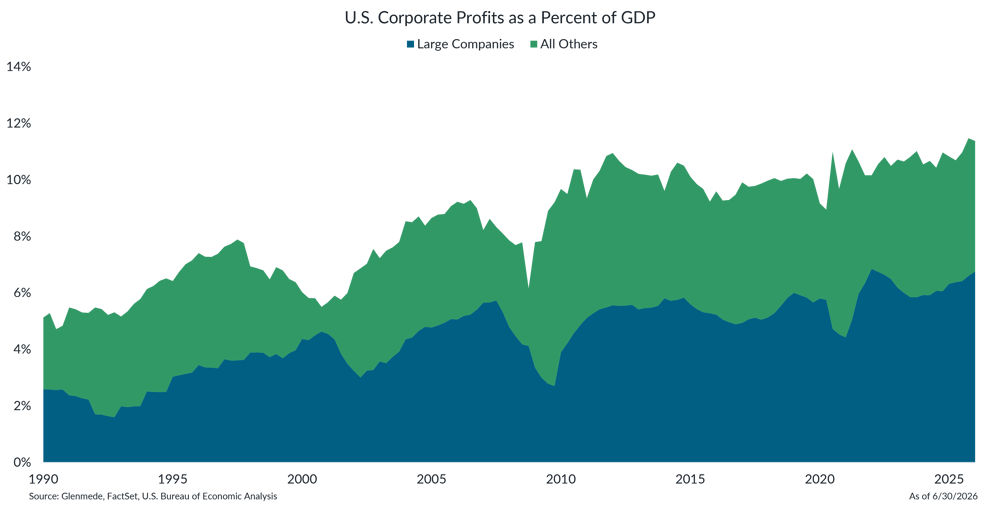
Shown are U.S. after-tax corporate profits as a percentage of gross domestic product (GDP). The blue area represents aggregate S&P 500 12-month trailing net income as a percentage of GDP and serves as a proxy for large public companies. The green area represents the remaining share of corporate profits earned by the broader U.S. corporate sector, including both public and private corporations, and are adjusted for inventory valuation and capital consumption.
-
Corporate profitability has remained strong across both large public companies and the broader corporate sector, underscoring the broad-based nature of business resilience.
-
Strong profitability has helped sustain business investment, reinforcing capital spending as an important driver of economic growth.
Recession risks remain contained, supporting a resilient economic growth outlook
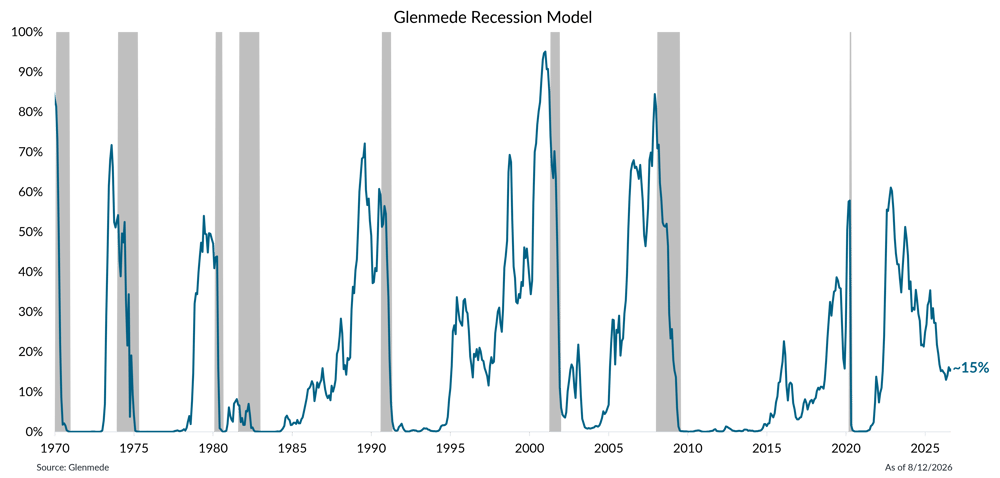
Shown is Glenmede’s Recession Model, a tool developed by Glenmede to estimate the probability of a recession in the U.S. occurring within the next 12 months. The model is a balanced mix of (1) long-term excess indicators covering manufacturing, employment, and debt balances and (2) near-term leading indicators covering monetary policy, credit markets, business sentiment, and other economic trends. Shaded areas represent recession periods of the U.S. economy. Though created in good faith, there can be no guarantee that these indicators will be accurate. The model was established in 2015. The data shown for prior periods represent backtested results. Actual results may differ materially from projections.
-
Glenmede’s Recession Model remains well below levels that have historically preceded economic downturns, suggesting the current expansion remains on solid footing.
-
The U.S. economy remains positioned for continued growth through the balance of 2026, supported by resilient households, strong corporate profitability, and ongoing business investment.
-
Amid this backdrop, investors should maintain a full allocation to risk assets while proactively rebalancing portfolios in-line with target allocations.
For more in-depth information on this topic, please reach out to your Glenmede Relationship Manager.

This material is provided solely for informational and/or educational purposes and is not intended as personalized investment advice. When provided to a client, advice is based on the client’s unique circumstances and may differ substantially from any general recommendations, suggestions or other considerations included in this material. Any opinions, recommendations, expectations or projections herein are based on information available at the time of publication and may change thereafter. Information obtained from third-party sources is assumed to be reliable but may not be independently verified, and the accuracy thereof is not guaranteed. Any company, fund or security referenced herein is provided solely for illustrative purposes and should not be construed as a recommendation to buy, hold or sell it. Outcomes (including performance) may differ materially from any expectations and projections noted herein due to various risks and uncertainties. Any reference to risk management or risk control does not imply that risk can be eliminated. All investments have risk. Clients are encouraged to discuss any matter discussed herein with their Glenmede representative.