

Investment Strategy Brief | October 12, 2026
The Impact of Rising Rates

Executive Summary
-
The strength of the economy and corporate profits has provided an offset to high valuations.
-
Interest rates have risen meaningfully, with direct implications for budget constraints in the U.S. and other developed nations.
-
Higher rates have a tendency to slow the economy or cause systemic disruption, sometimes in unexpected places.
-
Bond yields have become increasingly competitive, though equities still retain an expected return advantage.
-
Investors should consider higher yields an opportunity to rebalance portfolios and manage overall portfolio risk.
The strength of the economy and corporate profits has provided an offset to high valuations
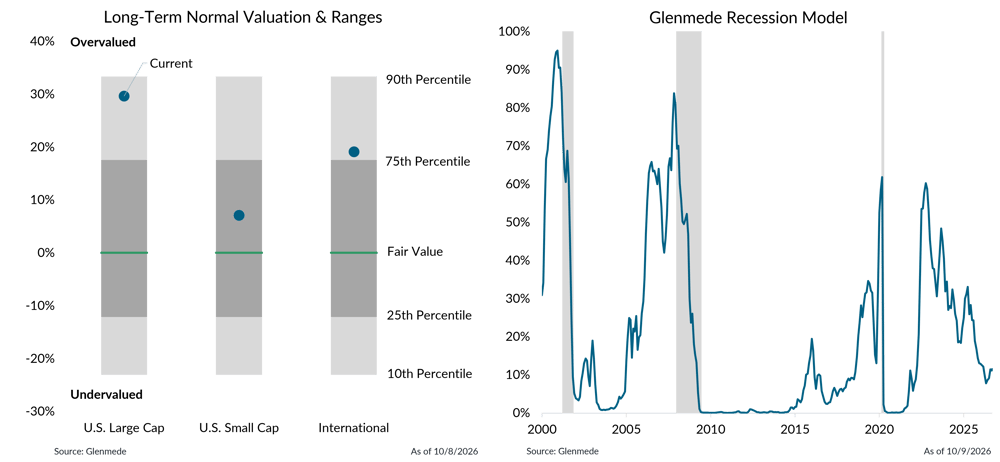
Shown on the left are Glenmede’s estimates of long-term fair value for U.S. Large Cap (MSCI USA), U.S. Small Cap (MSCI USA Small), International (MSCI All Country World ex-U.S.) based on normalized earnings, normalized cash flows, dividend yield, and book value for each index. Blue dots represent current valuation levels. Shown on the right is Glenmede’s Recession Model, a tool developed by Glenmede to estimate the probability of a recession in the U.S. occurring within the next 12 months. The model is a balanced mix of (1) long-term excess indicators covering manufacturing, employment, and debt balances and (2) near-term leading indicators covering monetary policy, credit markets, business sentiment, and other economic trends. Shaded areas represent recession periods of the U.S. economy. The model was established in 2015. The data shown for prior periods represent backtested results. Actual results may differ materially from projections. Though created in good faith, there can be no guarantee that these indicators will be accurate. One cannot invest directly in an index. Glenmede’s estimates of fair value are arrived at in good faith, but longer-term targets for valuation may be uncertain.
-
U.S. large-cap equities remain near the upper end of historical valuation ranges, while international markets and small caps appear less extended.
-
Economic and profit growth has remained quite strong, as evidenced by our model’s relatively low level of recession risk.
The increase in bond yields this year is a notable but a relatively common historical phenomenon
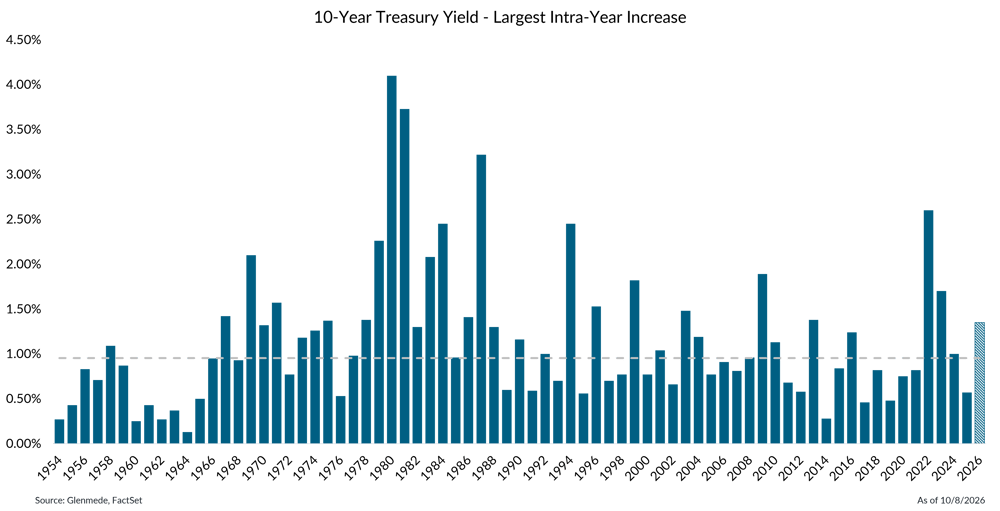
Shown are the largest intra-year increases in the 10-year U.S. Treasuries by calendar year. The dashed gray line represents the median across the dataset. Past performance may not be indicative of future results.
-
The 10-year Treasury yield rose from roughly 4.5% at the start of the third quarter to above 5.2% by quarter-end, extending the broader upward trend that began in February.
-
This rise in yields is now notably larger than the historic average intra-year rise in rates but is far from unprecedented in magnitude.
-
Historically, an increase in rates of this magnitude has occurred at a 1-in-3-year frequency, though it was much rarer in the post-2009 period when the Federal Reserve was expanding its balance sheet.
Government interest costs may soon justify budget adjustments, but the risk of default appears low
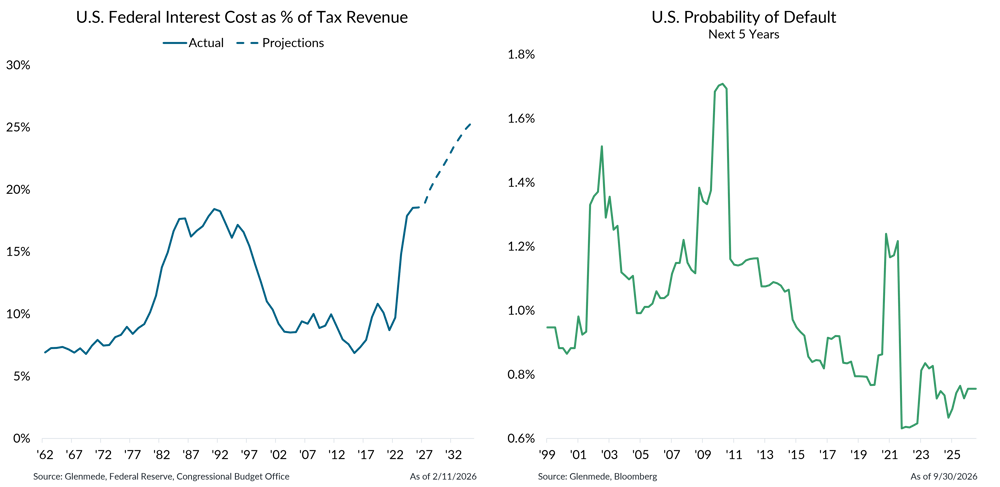
Shown on the left are U.S. government net interest costs (total interest paid minus interest received) as a percent of tax revenues collected each year. The dotted line represents projections based on Congressional Budget Office estimates. Shown on the right is the output of Bloomberg's Sovereign Risk Model, which provides an estimate of the probability of sovereign default based on financial, macroeconomic, and political risk factors. Actual results may differ materially from estimates or projections.
-
The rise in yields should gradually seep into government interest costs as prior lower-rate bonds mature and are replaced by newly issued bonds at higher rates.
-
This should primarily put pressure on the government’s budget as interest costs gain as a share of total government spending but is not expected to lead to increased risk of a default.
Rising yields are renewing fiscal concerns across Europe as well
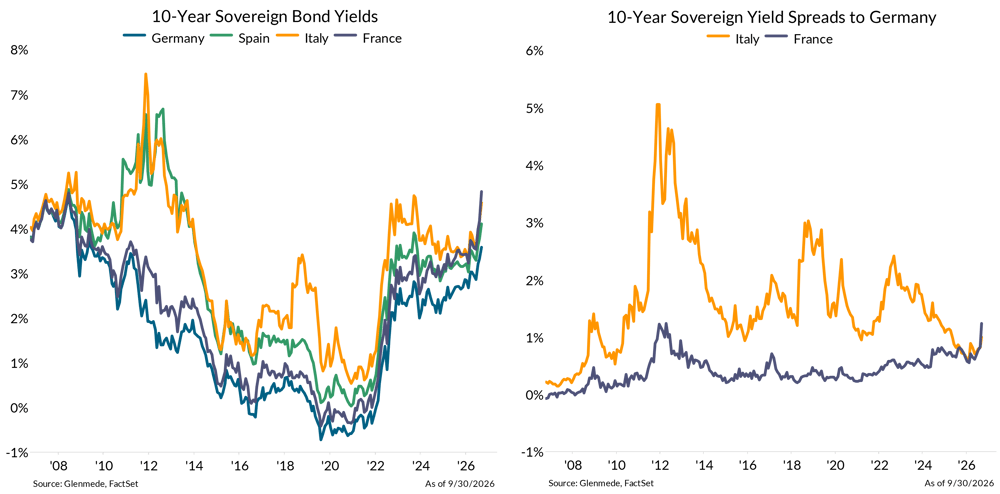
Shown on the left are yields on 10-year government bonds issued by France, Italy, Spain, and Germany. The right panel shows the spread, in percentage points, between the 10-year government bond yield of France or Italy and that of Germany.
-
Yields on sovereign bonds of European nations have seen a similar rise in rates, leading to similar concerns about the impact on their fiscal budgets.
-
Interest rate spreads do point to a modest increase in default risk, but that pricing still looks far more contained than the 2011-2012 European debt crisis.
When the fed funds rate breaches the neutral rate, the economy often encounters some difficulty
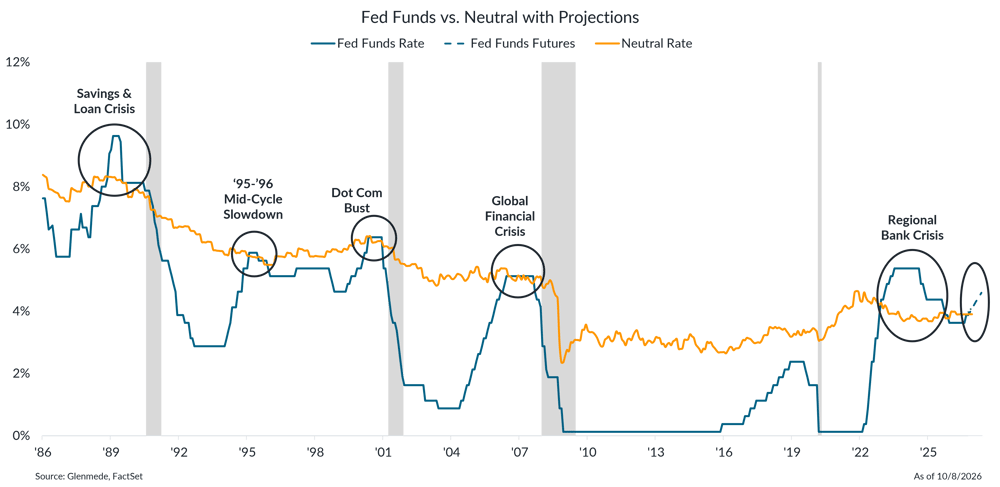
Shown in orange are Glenmede’s estimates of the neutral federal funds rate over time (i.e., the level of rates that is neither economically stimulative nor restrictive) based on expectations for real interest rates via the Holston-Laubach-Williams model and Glenmede’s inflation expectations. Fed Funds Rate in blue is the target rate midpoint. The dashed blue line represents expectations for the forward path of rates based on fed funds futures pricing. Shaded areas represent U.S. recessions as defined by the National Bureau of Economic Research. Projections and expectations are arrived at in good faith, but actual results may differ materially.
-
The neutral rate is the level of the federal funds rate that neither stimulates nor restricts the economy. When the Fed pushes its policy rate above that level, borrowing becomes restrictive, and strain can build in the parts of the economy most sensitive to credit.
-
Over the past four decades, tightening cycles that took the federal funds rate above neutral have often preceded slowdowns in the economy like in 1996 and stresses in the financial system like the Savings and Loan Crisis, the Global Financial Crisis, and the regional bank collapse.
Bond yields have become increasingly competitive, though equities still retain an expected return advantage
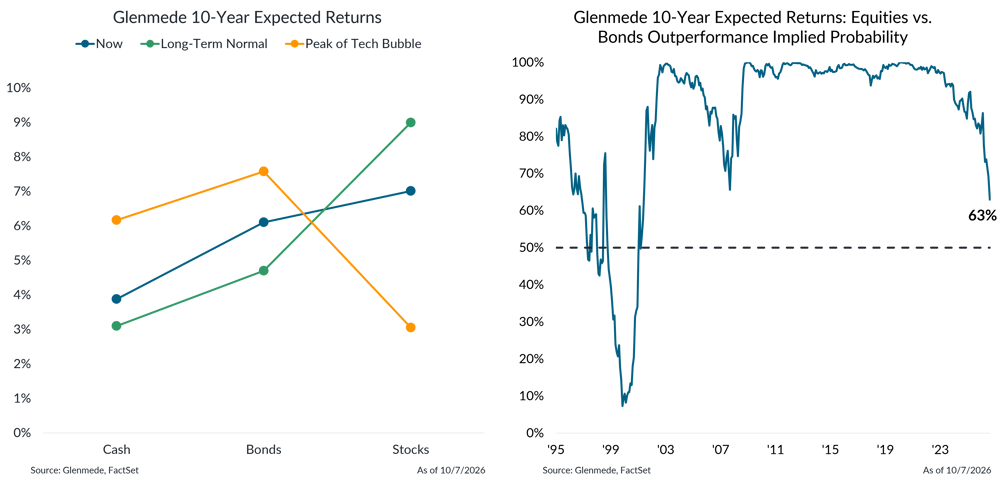
Shown on the left are Glenmede’s 10-year expected returns for Cash (Bloomberg Treasury Bellwethers 3M), Bonds (Bloomberg U.S. Aggregate), and Stocks (S&P 500) at select points in time. Shown on the right is the implied probability that equities will outperform bonds over the next 10 years, based on Glenmede’s 10-year expected return assumptions for Global Equities (MSCI AC World) and U.S. Core Fixed Income (Bloomberg U.S. Aggregate), both measured in U.S. dollars. The probability is estimated using the standard deviation of the difference in expected returns and assumes a normal distribution of outcomes. Glenmede’s estimates of expected returns are arrived at in good faith, but longer-term targets for returns may be uncertain. Actual returns may differ materially from projections. One cannot invest directly in an index.
-
The rise in rates, however, makes bonds considerably more compelling for investors to own. The recent backup in yields has brought the forward expected return on bonds much closer to the forward expected return on equities.
-
Stocks are still more likely to outperform bonds over the next 10 years, but that probability has declined with the rise in rates.
-
Investors should consider higher yields an opportunity to rebalance portfolios and manage overall portfolio risk.
For more in-depth information on this topic, please reach out to your Glenmede Relationship Manager.

This material is provided solely for informational or educational purposes and is not intended as personalized investment advice. When provided to a client, advice is based on the client’s unique circumstances and may differ substantially from any general recommendations, suggestions, or other considerations included in this material. Any opinions, recommendations, expectations, or projections included herein are subject to change, and any potential outcome discussed, including but not limited to performance, legislation, or tax consequence, ultimately may not occur. Information obtained from third-party sources is assumed to be reliable but may not be independently verified, and the accuracy thereof is not guaranteed. Any company, fund, or security referenced herein is provided solely for illustrative purposes and is not a recommendation to buy, hold, or sell it. Any reference to risk management or risk control does not imply that risk can be eliminated. All investments have risk. Readers should contact Glenmede or consult with a financial, investment, tax, legal, or other advisor if they have any questions about this material or want advice or more information.