Investment Strategy Brief
The Top 5 Risks Spooking Investors
October 26, 2025

Executive Summary
- The prolonged government shutdown is likely to have a notable but recoverable impact on the economy.
- Inflation is likely to feel a one-time tailwind of 0.5% to 1.0% as consumers begin picking up the cost of tariffs.
- Unemployment is gradually trending higher but is not spiking in a manner consistent with past recessions.
- Widening high-yield spreads show signs of incremental strain but fall well short of systemic concerns.
-
Market leadership has become overly concentrated, with artificial intelligence (AI)-driven firms fueling record levels of capital spending.
The prolonged government shutdown is likely to have a notable but recoverable impact on the economy
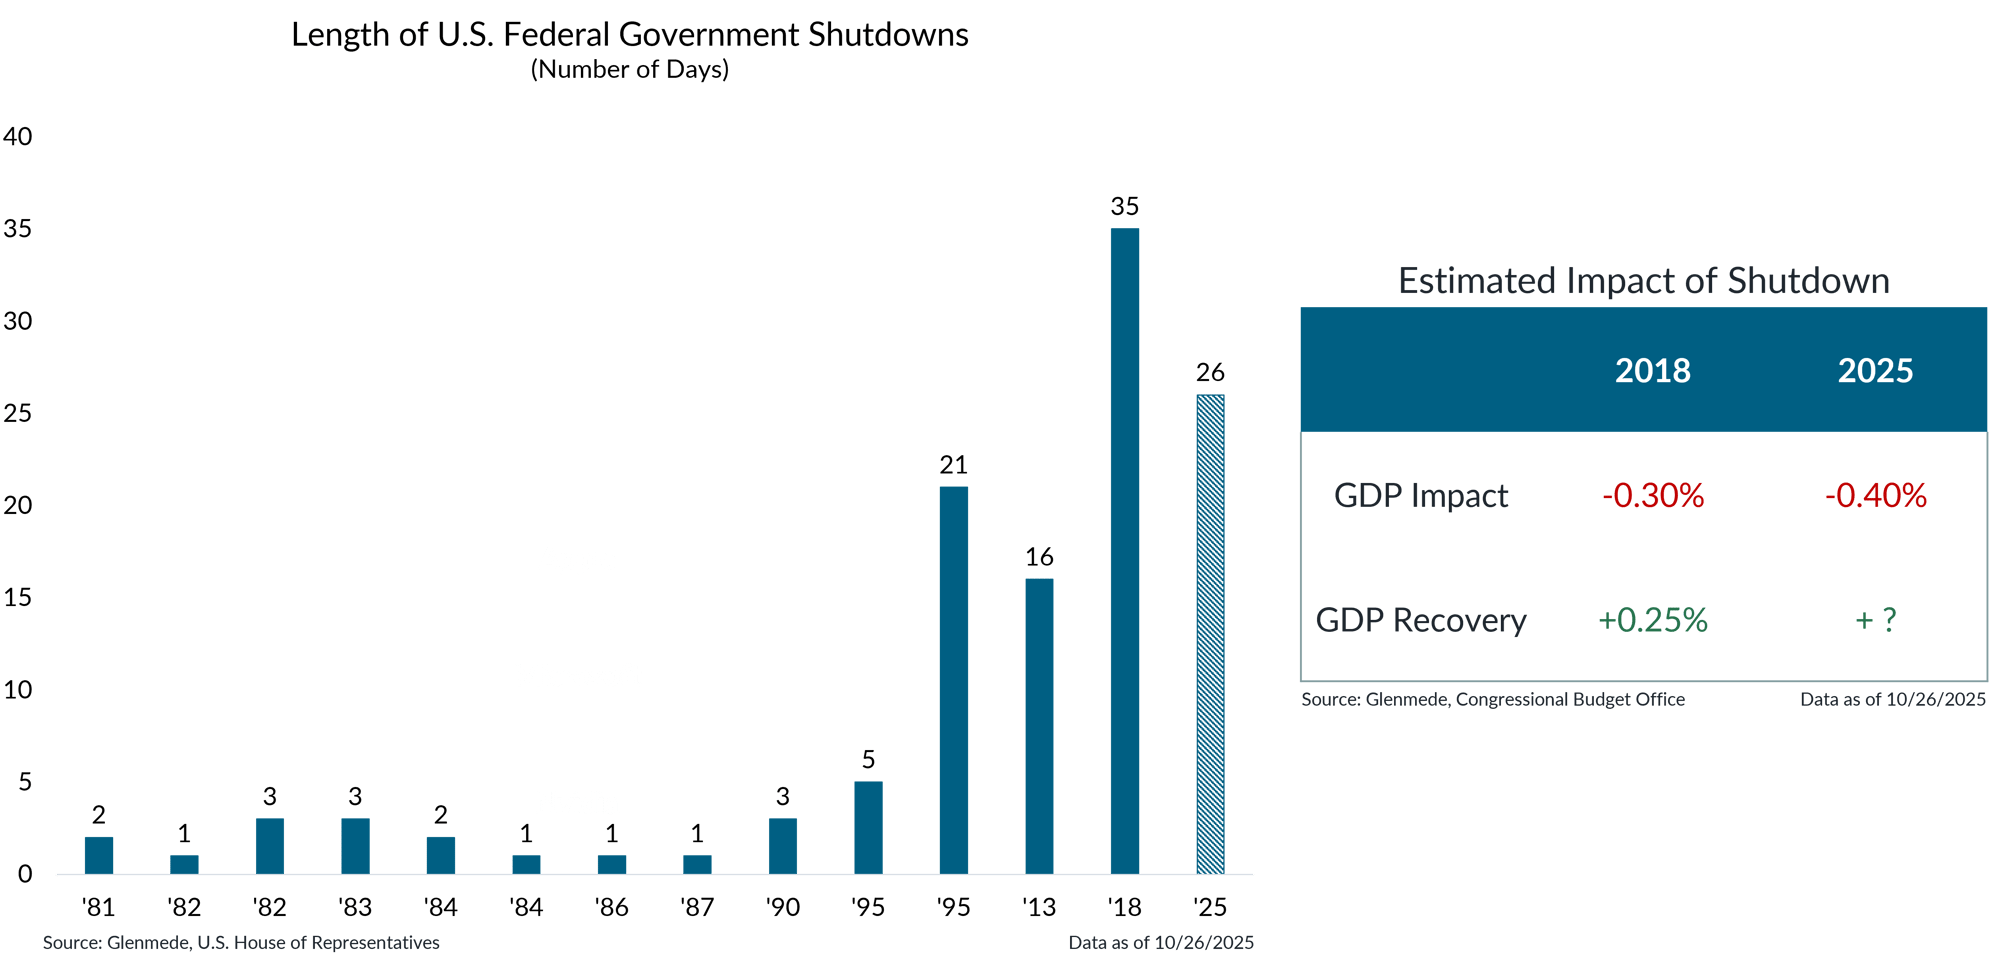
Shown in the left panel are the cumulative durations of each U.S. federal government shutdown since 1981, measured in number of days. Each shutdown is labeled by the year in which the shutdown began, though some shutdowns spanned multiple years. For example, the shutdown that started in 2018 but extended into 2019 is denoted as ’18. The hashed bar for ’25 denotes the ongoing nature of the shutdown. Shown in the table are estimates of the effect on real gross domestic product (GDP) from the last government shutdown and for the current ongoing shutdown. Real GDP measures the total increase in a country’s inflation-adjusted output of goods and services. Past performance may not be indicative of future results. Actual results may differ materially from expectations or projections.
- The current shutdown is now the second longest in U.S. history and is starting to have a notable impact on the economy.
- Shutdowns have historically seen a recovery of lost economic activity, but there is evidence of a modest shortfall in recoveries following more extended shutdowns.
Inflation is likely to feel a one-time tailwind of 0.5% to 1.0% as consumers continue picking up the cost of tariffs
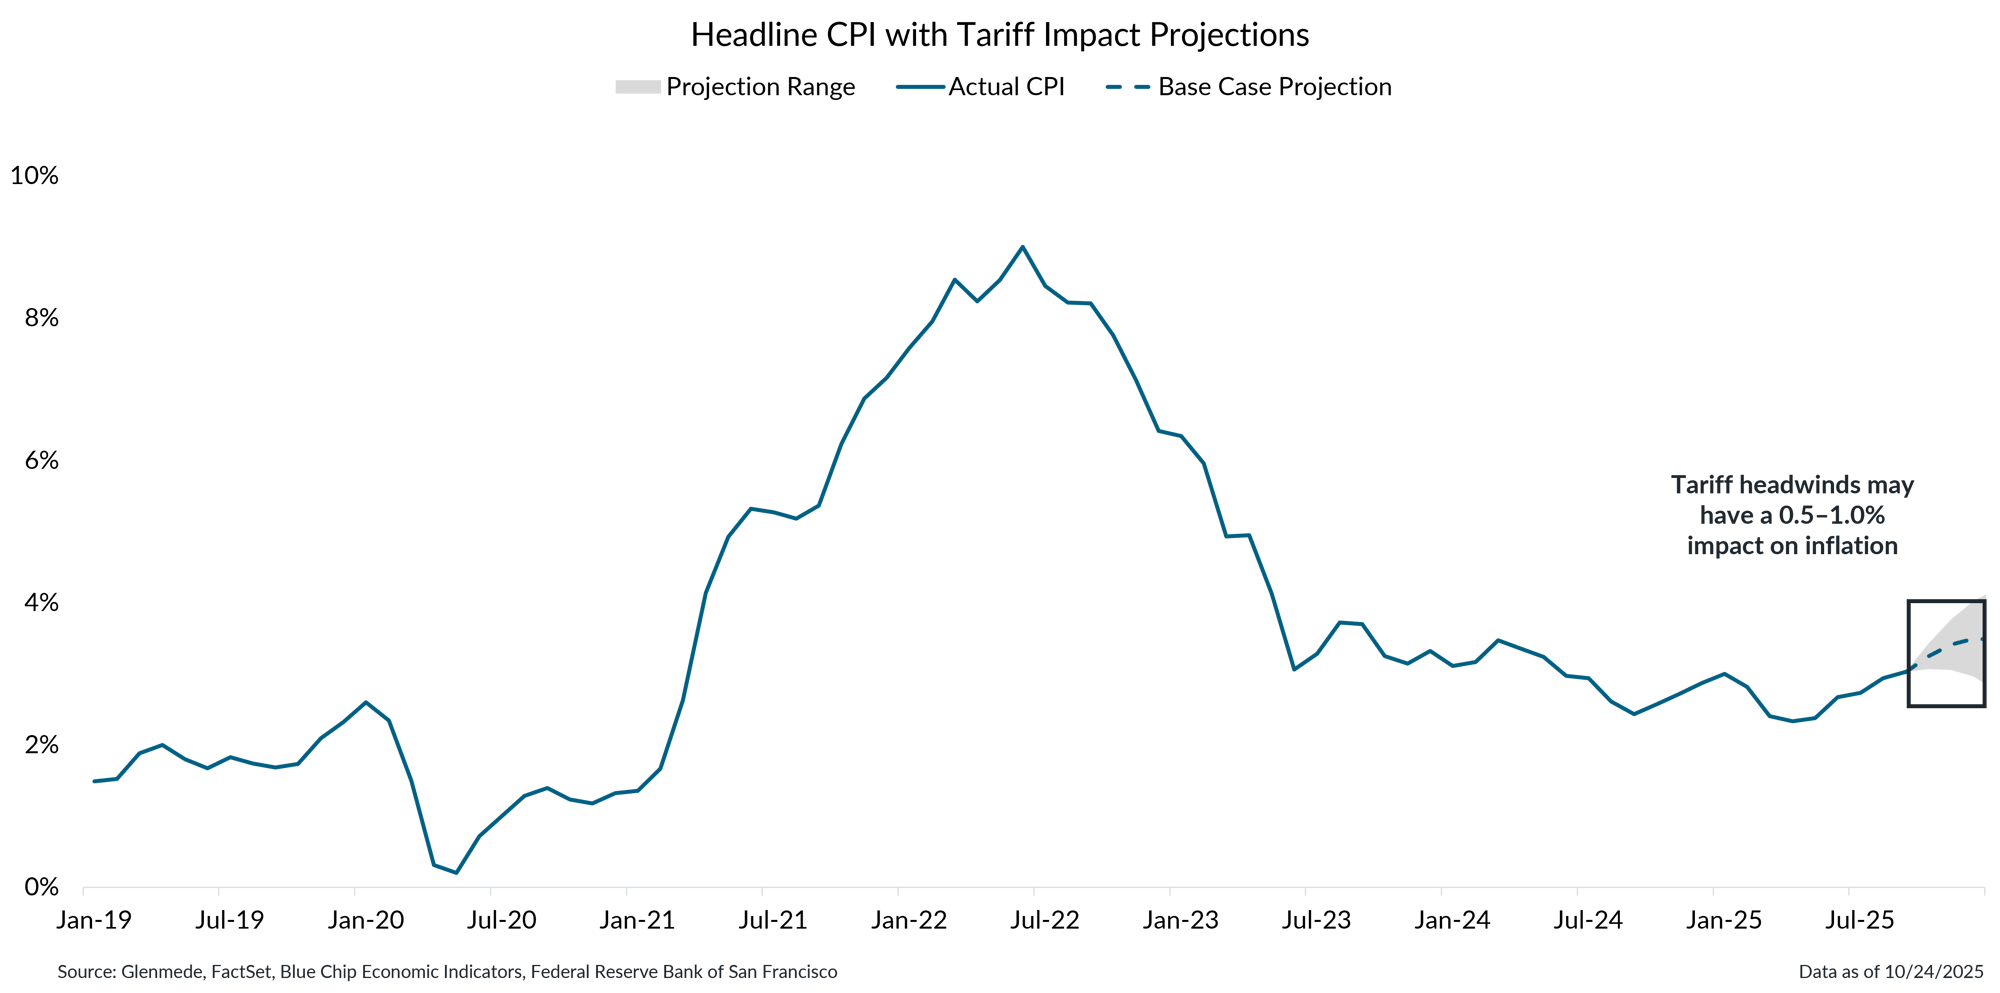
Data shown in blue is the year-over-year percent change in the U.S. Consumer Price Index (CPI). The dashed blue line represents Glenmede’s base case projections, and the gray region represents a range of plausible outcomes. Projections assume all price increases are passed on to consumers. Actual results may differ materially from expectations or projections.
- The recent rise in core goods prices is likely to continue as businesses pass along more of their tariff-related cost increases to consumers.
- This one-time price adjustment is projected to add between 0.5% and 1.0% to overall inflation over the coming months, as the effects gradually work their way through the economy.
Unemployment is gradually trending higher but is not spiking in a manner consistent with past recessions
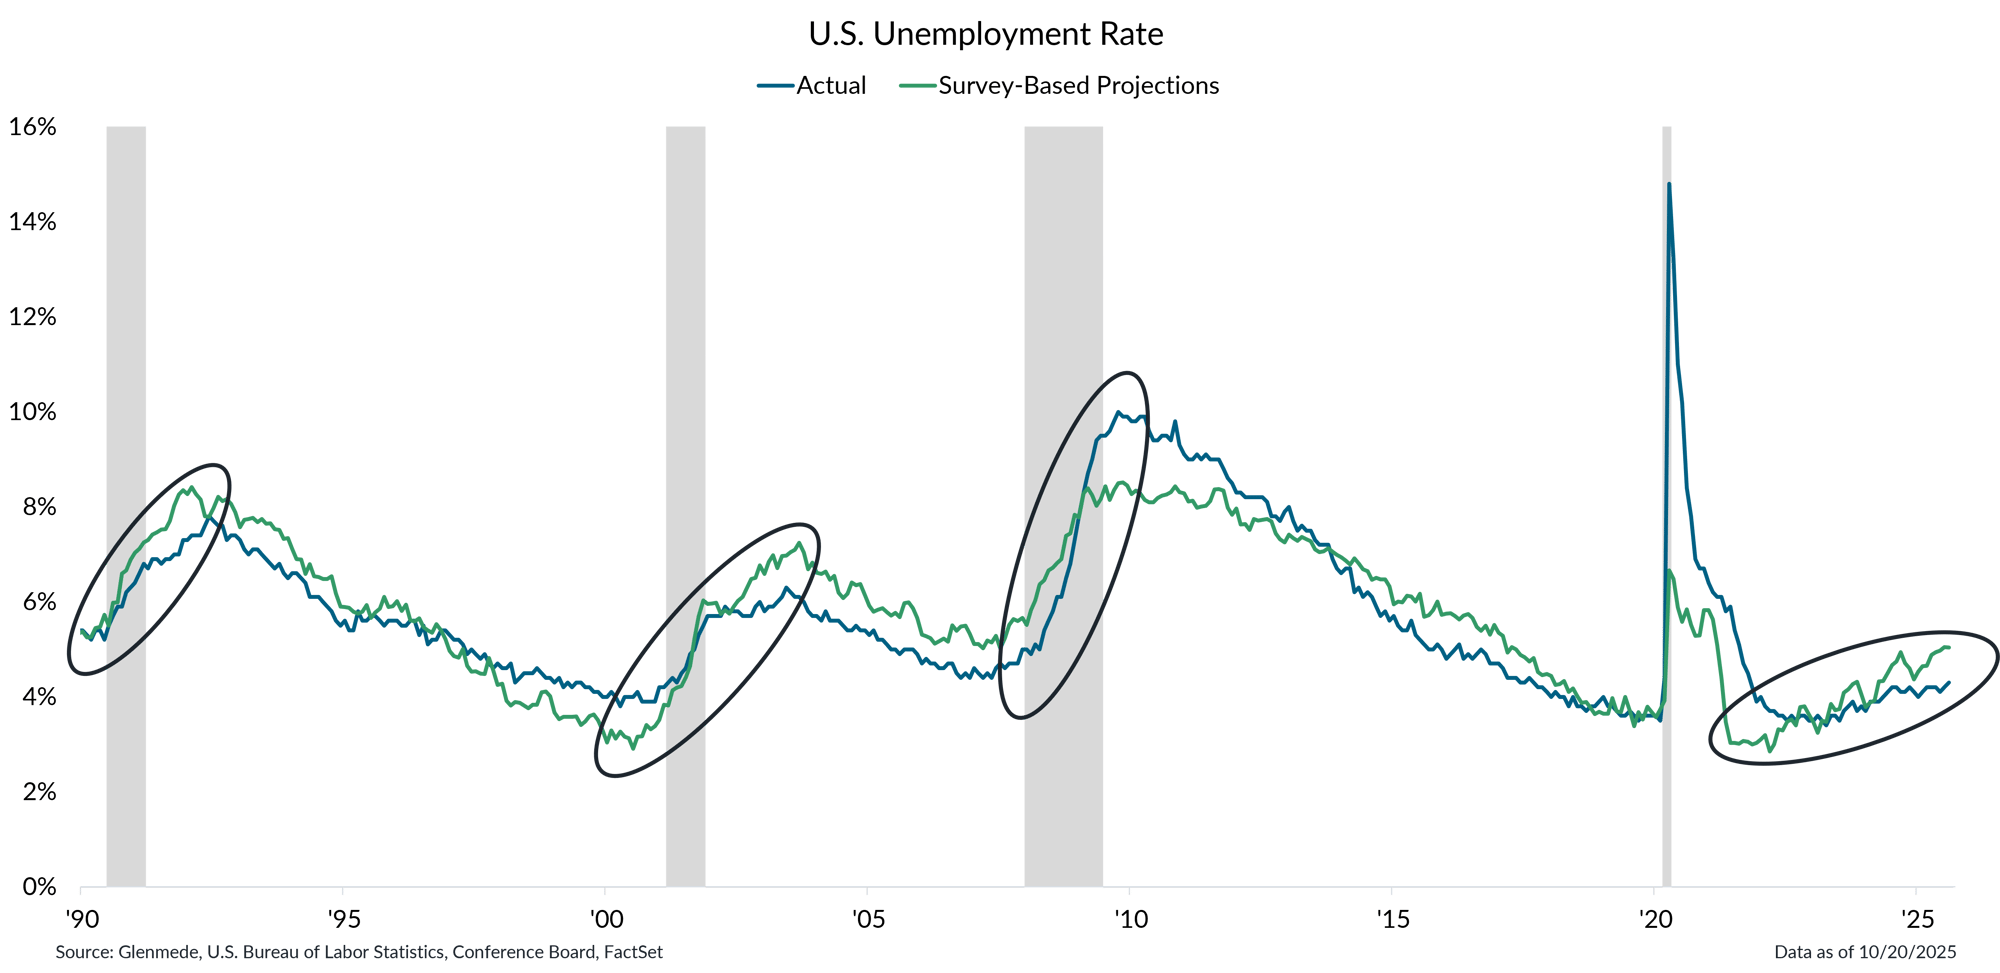
Data shown in blue represent the U.S. unemployment rate for persons ages 16 years and older on a seasonally adjusted basis. Data shown in green represent the output of a projection model based on the Conference Board’s Consumer Confidence Survey, using the net share of respondents reporting jobs are plentiful versus hard to get. Gray-shaded regions represent periods of recession in the U.S. Actual results may differ materially from projections.
- Amid the dearth of official data, consumer surveys can be a reasonable proxy for the state of the labor market. Currently, that data suggest the unemployment rate could continue its gradual rise.
- The drift higher in jobless rates has occurred slowly from historically low levels and is not consistent with the typical spikes higher that are a hallmark of an unfolding recession.
Widening high-yield spreads show signs of incremental strain but fall well short of systemic concerns
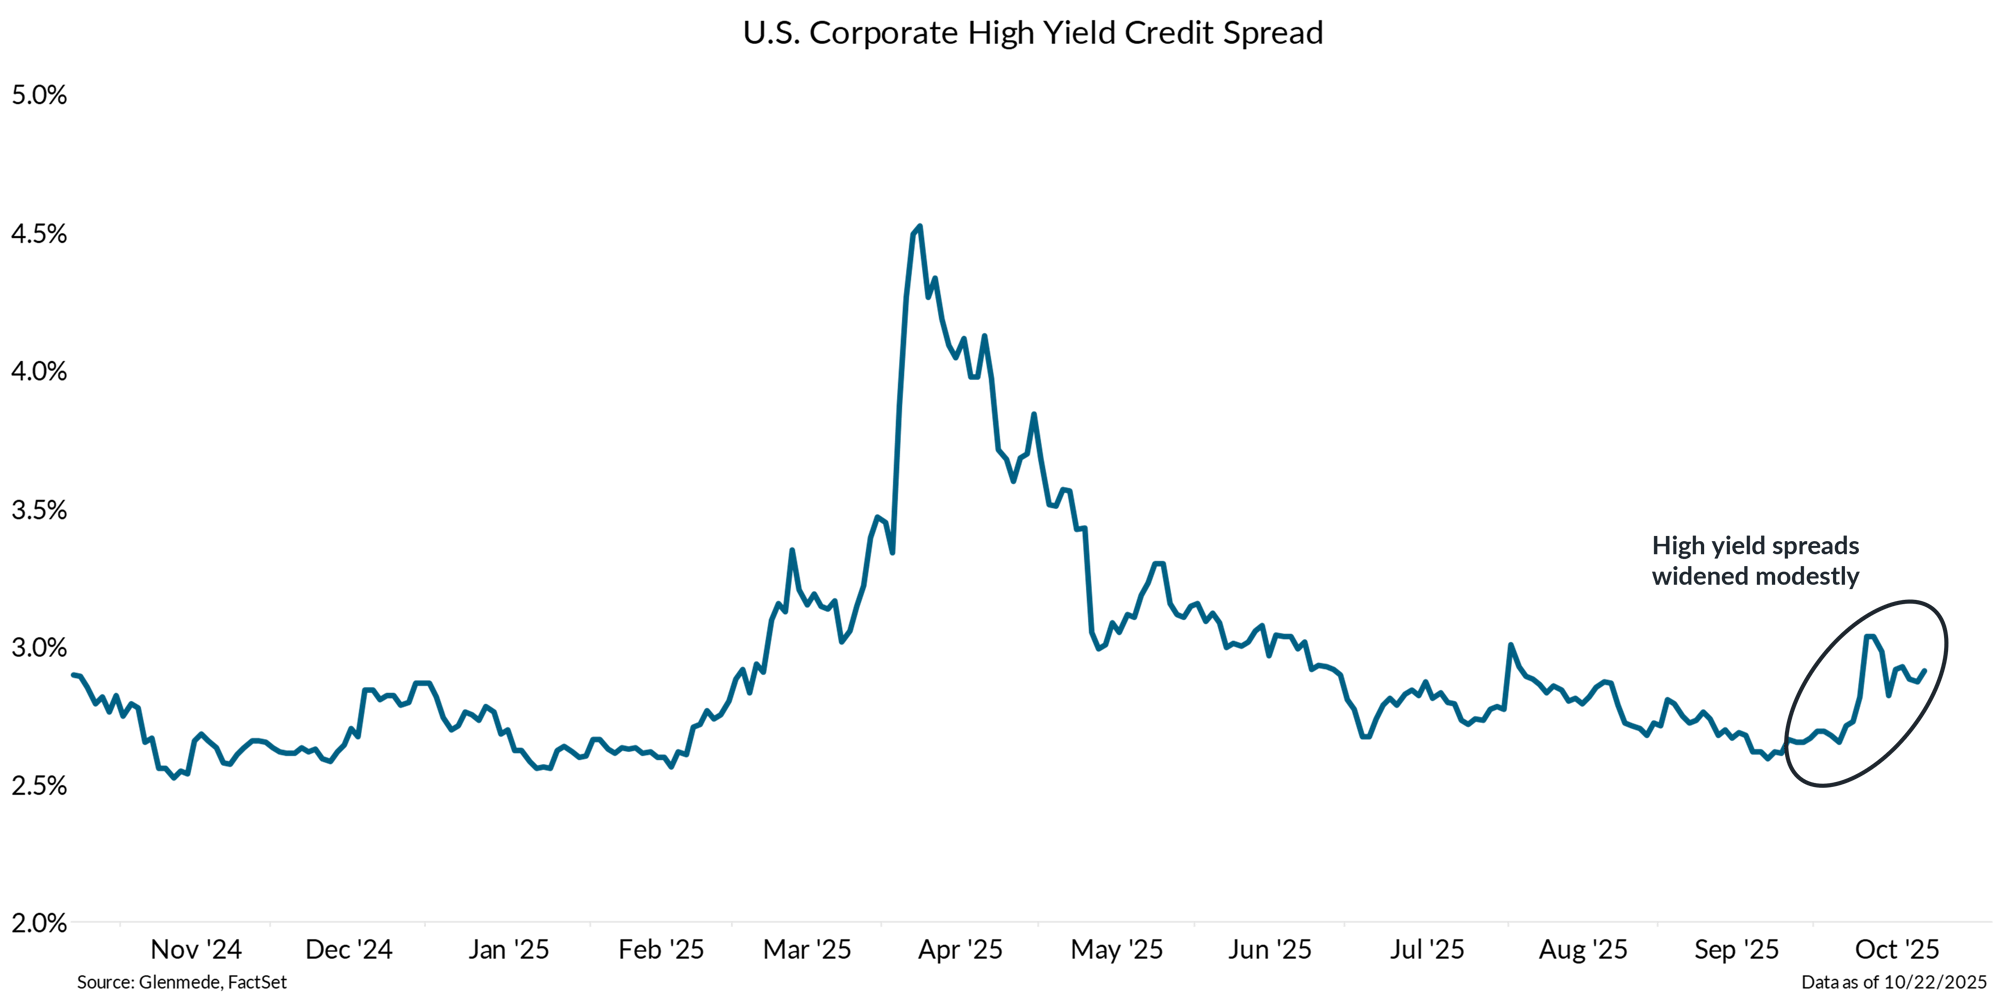
Data shown are option-adjusted spreads for the Bloomberg U.S. Aggregate Credit Corporate High Yield Index. Past performance may not be indicative of future results. One cannot invest directly in an index.
- High-yield credit spreads are widening, signaling incremental signs of stress in lower-quality corporate debt as investors demand greater compensation for risk.
- However, the recent rise comes off historically low levels for spreads and is not consistent with periods of systemic stress, such as the tariff rollout fears that unfolded in early April.
Market leadership has become overly concentrated, with AI-driven firms fueling record levels of capital spending
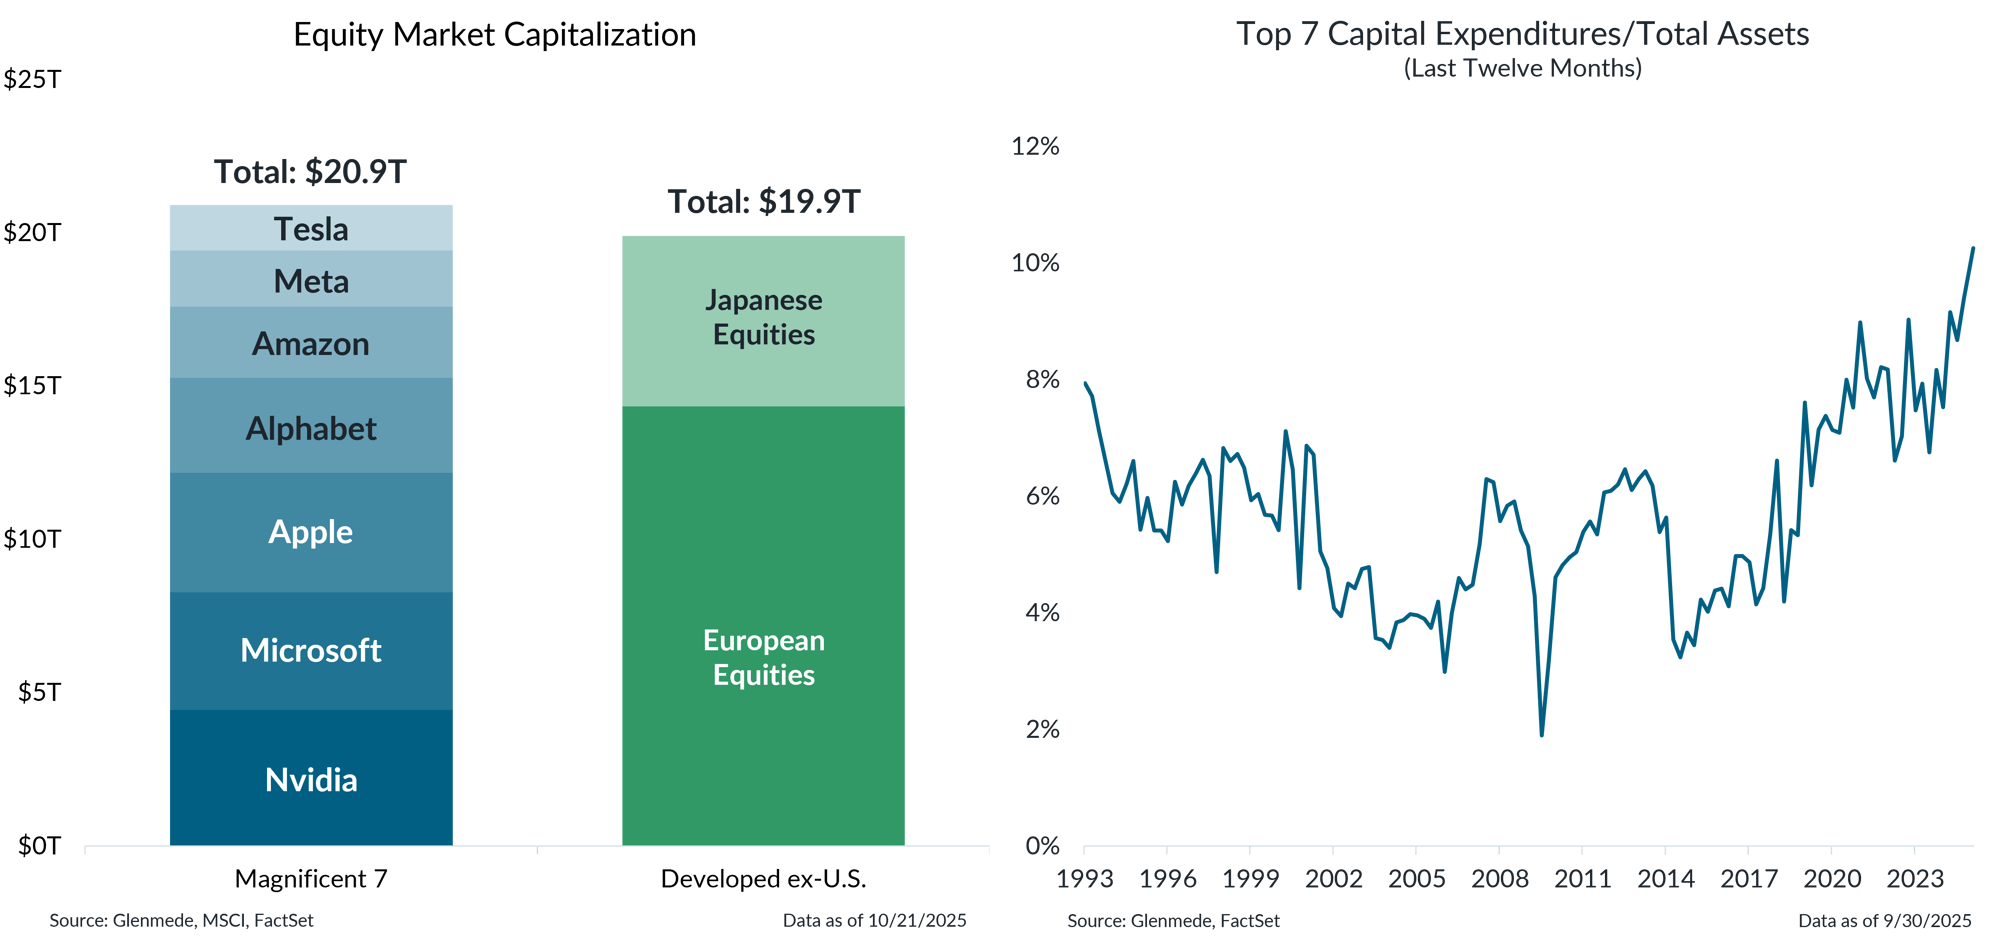
Data shown in the left panel are market capitalizations in U.S. dollars for the Magnificent 7 (Nvidia, Apple, Microsoft, Alphabet, Amazon, Meta Platforms, and Tesla). Japanese equities and European equities are represented by the MSCI Investable Market Index (IMI) for each region, which captures large, mid, and small cap securities covering roughly 99% of each market’s free-float adjusted capitalization. Data shown in the right panel represent average capital expenditures as a share of total assets, measured on a last-12-month basis, for the largest seven companies in the S&P 500 at each point in time. This visual should not be interpreted as a recommendation to buy, hold, or sell any specific securities. Past performance may not be indicative of future results. One cannot invest directly in an index.
- Equity market concentration continues to hit new extremes. The combined value of the Magnificent 7 now eclipses the 2,2000+ companies that make up European and Japanese equity markets.
- The top 7 companies are now deploying capital expenditures at a rate well beyond prior market leaders—a large wager on growing demand for AI computing services.
This material is provided solely for informational and/or educational purposes and is not intended as personalized investment advice. When provided to a client, advice is based on the client’s unique circumstances and may differ substantially from any general recommendations, suggestions or other considerations included in this material. Any opinions, recommendations, expectations or projections herein are based on information available at the time of publication and may change thereafter. Information obtained from third-party sources is assumed to be reliable but may not be independently verified, and the accuracy thereof is not guaranteed. Any company, fund or security referenced herein is provided solely for illustrative purposes and should not be construed as a recommendation to buy, hold or sell it. Outcomes (including performance) may differ materially from any expectations and projections noted herein due to various risks and uncertainties. Any reference to risk management or risk control does not imply that risk can be eliminated. All investments have risk. Clients are encouraged to discuss any matter discussed herein with their Glenmede representative.

