Investment Strategy Brief
Top 5 Things to
Watch in 2H 2025
September 7, 2025

Executive Summary
- Earnings expectations may see a transition from resiliency to a lift from lower tax rates.
- Capital spending may pick up as uncertainty recedes and paused investments are restarted.
- Inflation is likely to feel a one-time tailwind of 0.5–1.0% as consumers begin picking up the tariff tab.
- The Fed is expected to resume cutting rates and end quantitative tightening, loosening financial conditions.
- The dollar’s valuation may continue to slowly fade as its interest rate advantage declines.
Earnings expectations may see a transition from resiliency to a lift from lower tax rates
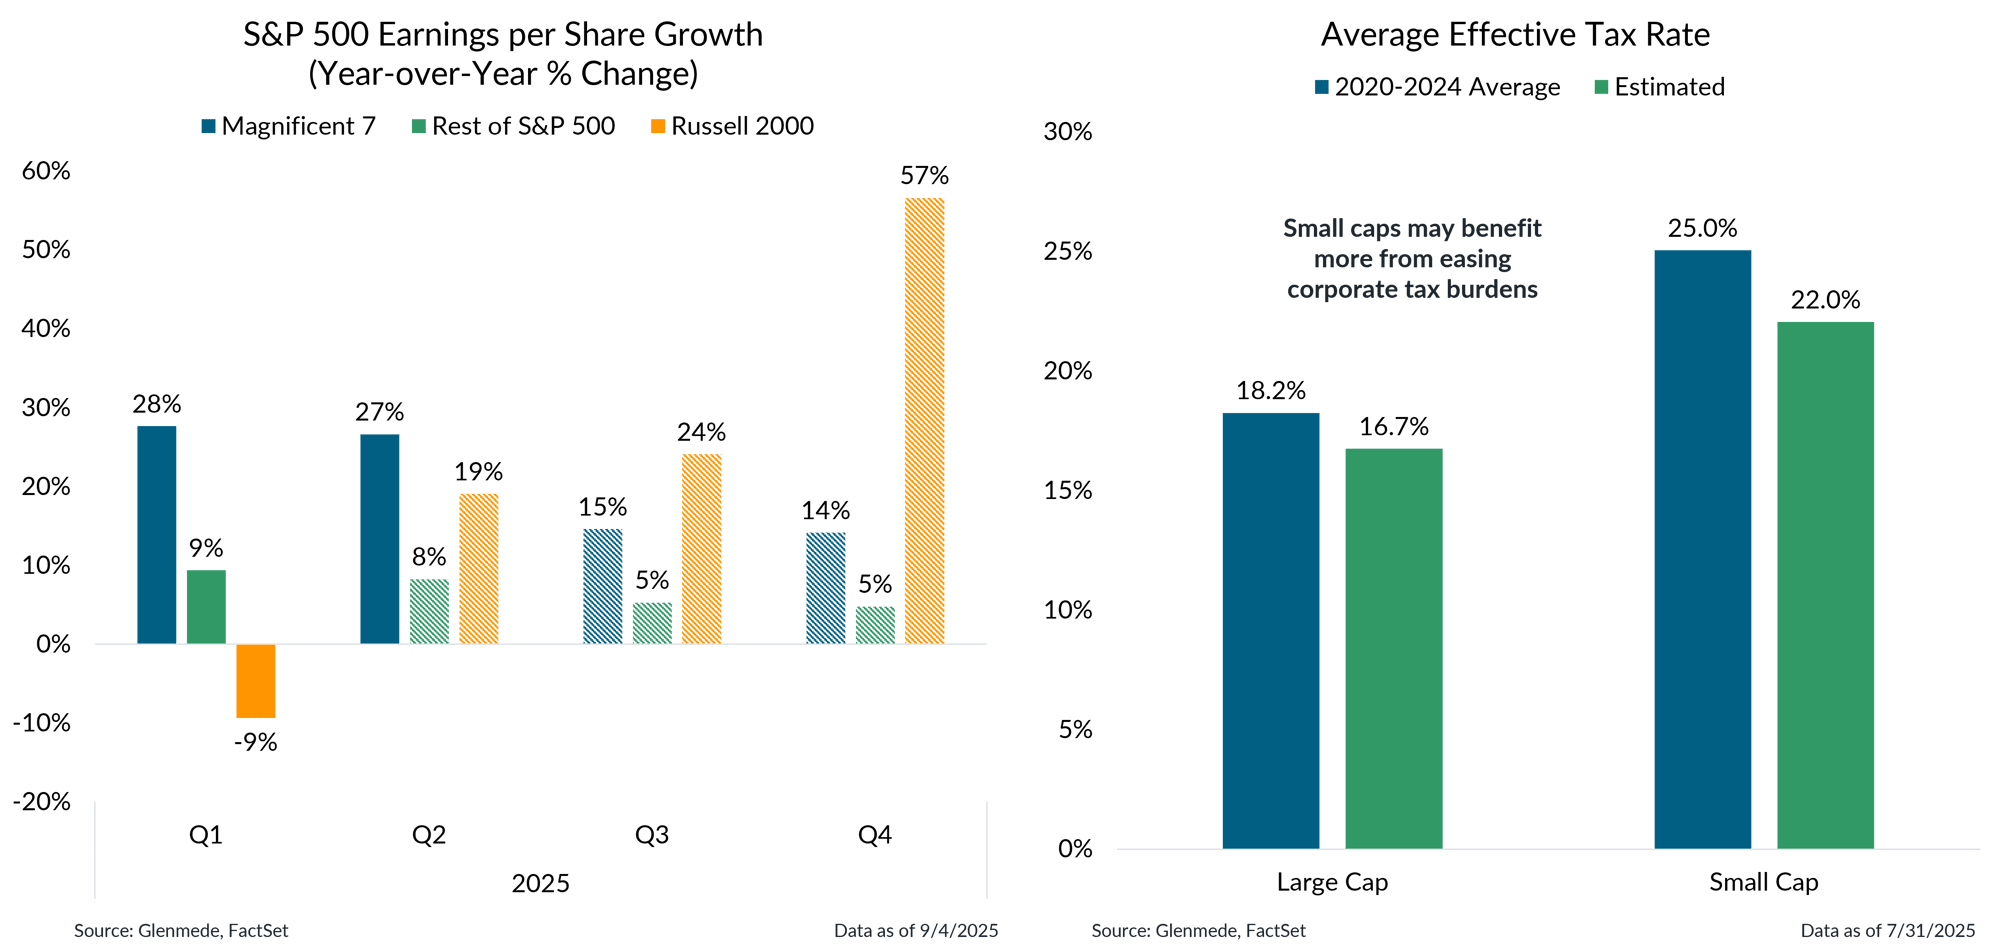
Shown in the left panel are quarterly earnings per share growth rates on a year-over-year percent change basis. Figures in blue represent the results for the Magnificent 7 (Apple, Amazon, Alphabet, Meta, Microsoft, Nvidia, Tesla), figures in green represent the rest of the stocks in the S&P 500 index and figures in orange represent the Russell 2000 index. Solid bars represent actual results and hashed bars represent projections based on bottom-up equity analysts’ estimates. Shown in the right panel are the 4-year average effective tax rates for large cap and small cap stocks, as represented by the S&P 500 and S&P 600 indexes, respectively. Past performance may not be indicative of future results. Actual results may differ materially from expectations. One cannot invest directly in an index. References to specific stocks should not be construed as advice to buy, hold or sell individual securities.
- Corporate earnings have remained resilient this year, largely unfazed by tariff uncertainty, and are expected to continue growing as the business provisions in the “One, Big, Beautiful Bill Act” (OBBBA) begin to take effect.
- The OBBBA provisions are expected to lower the average effective tax rate, with small cap companies likely benefitting more than large caps from enhanced interest and depreciation deductions.
Capital spending may pick up as uncertainty recedes and paused investments are restarted
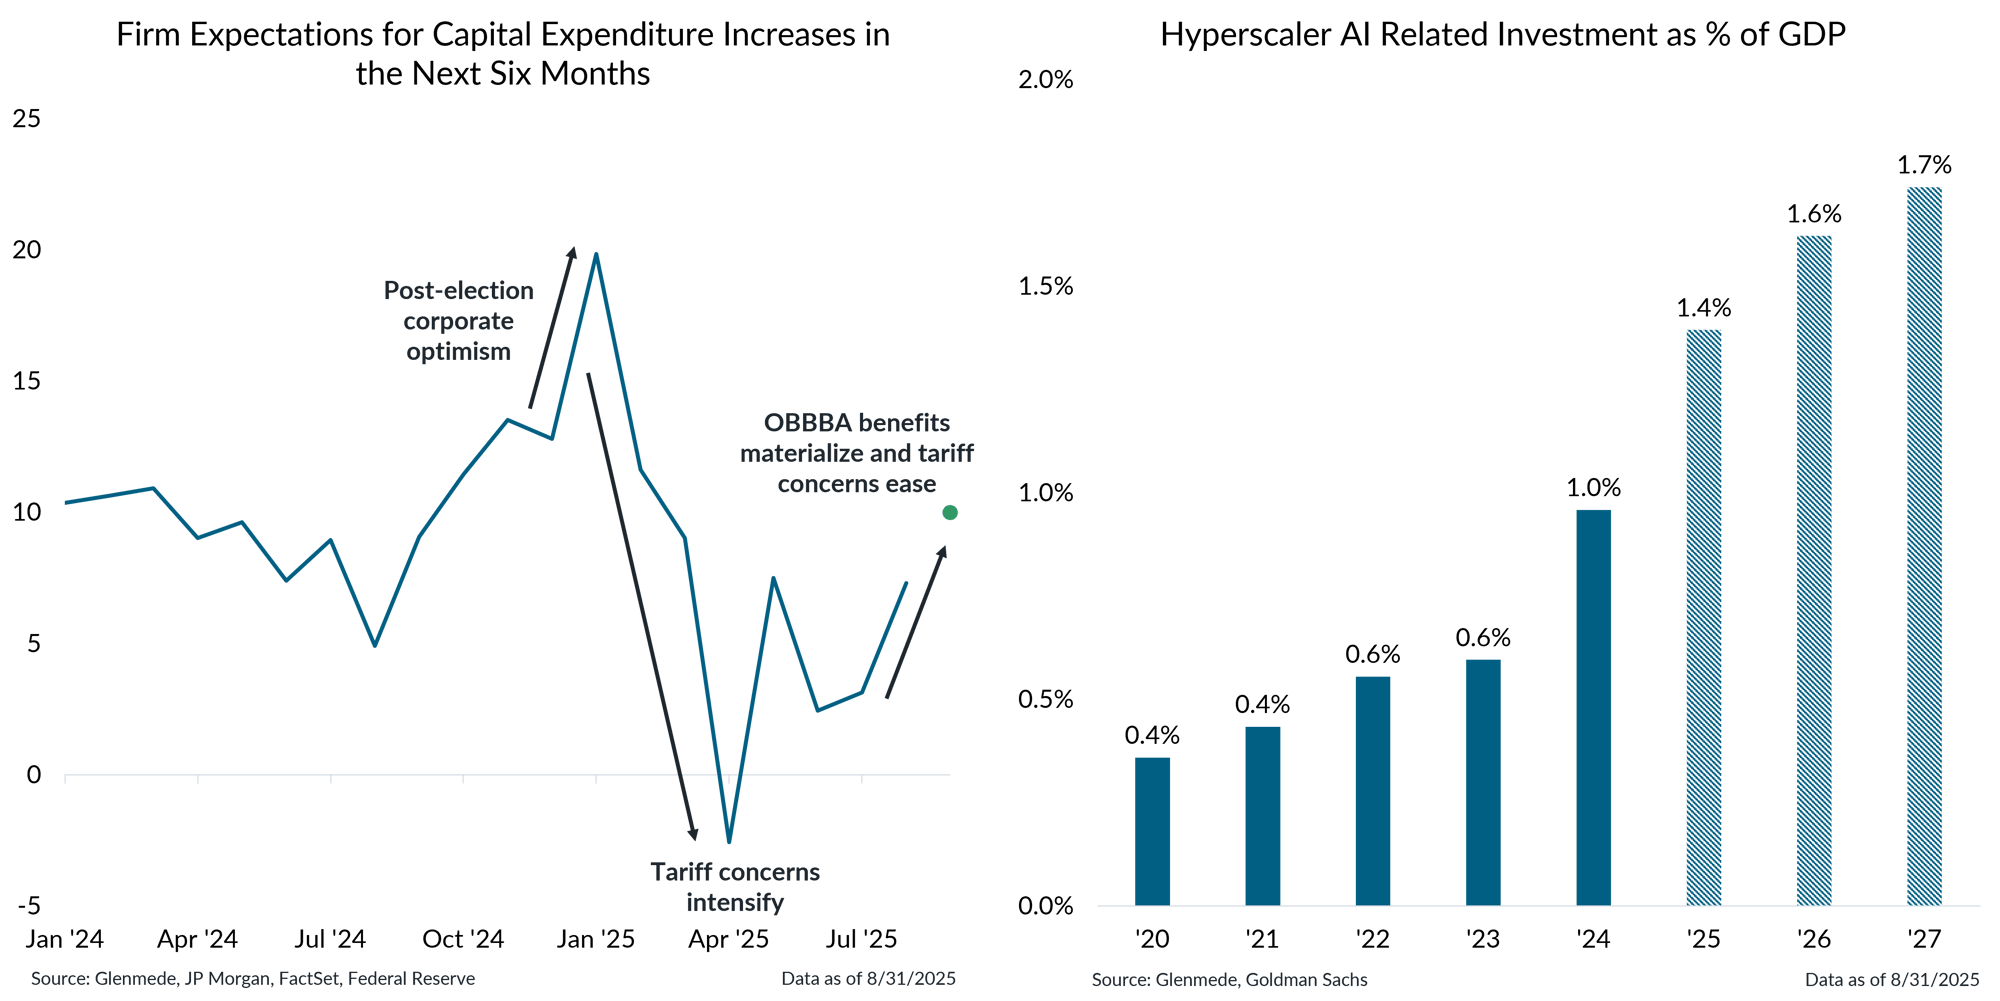
Data shown in the left panel represent the average value of the diffusion index for future capital expenditure increases from each of the surveys conducted by the Federal Reserve Banks of Philadelphia, New York, Richmond, Dallas and Kansas City. The green dot represents a projection for the coming month. Data shown in the right panel are the total capital expenditures from Oracle, Meta, Google, Amazon and Microsoft as a share of U.S. gross domestic product (GDP). Solid bars represent actual figures while hashed bars represent projections. Actual results may differ materially from expectations.
- In recent months, capital expenditure expectations have remained volatile, as businesses respond to a series of developments including election outcomes, tariff announcements and broader policy shifts.
- Meanwhile, AI related investment continues to accelerate, with major industry players making substantial commitments, expected to account for ~1.4% of GDP.
Inflation is likely to feel a one-time tailwind of 0.5 – 1.0% as consumers begin picking up the tariff tab
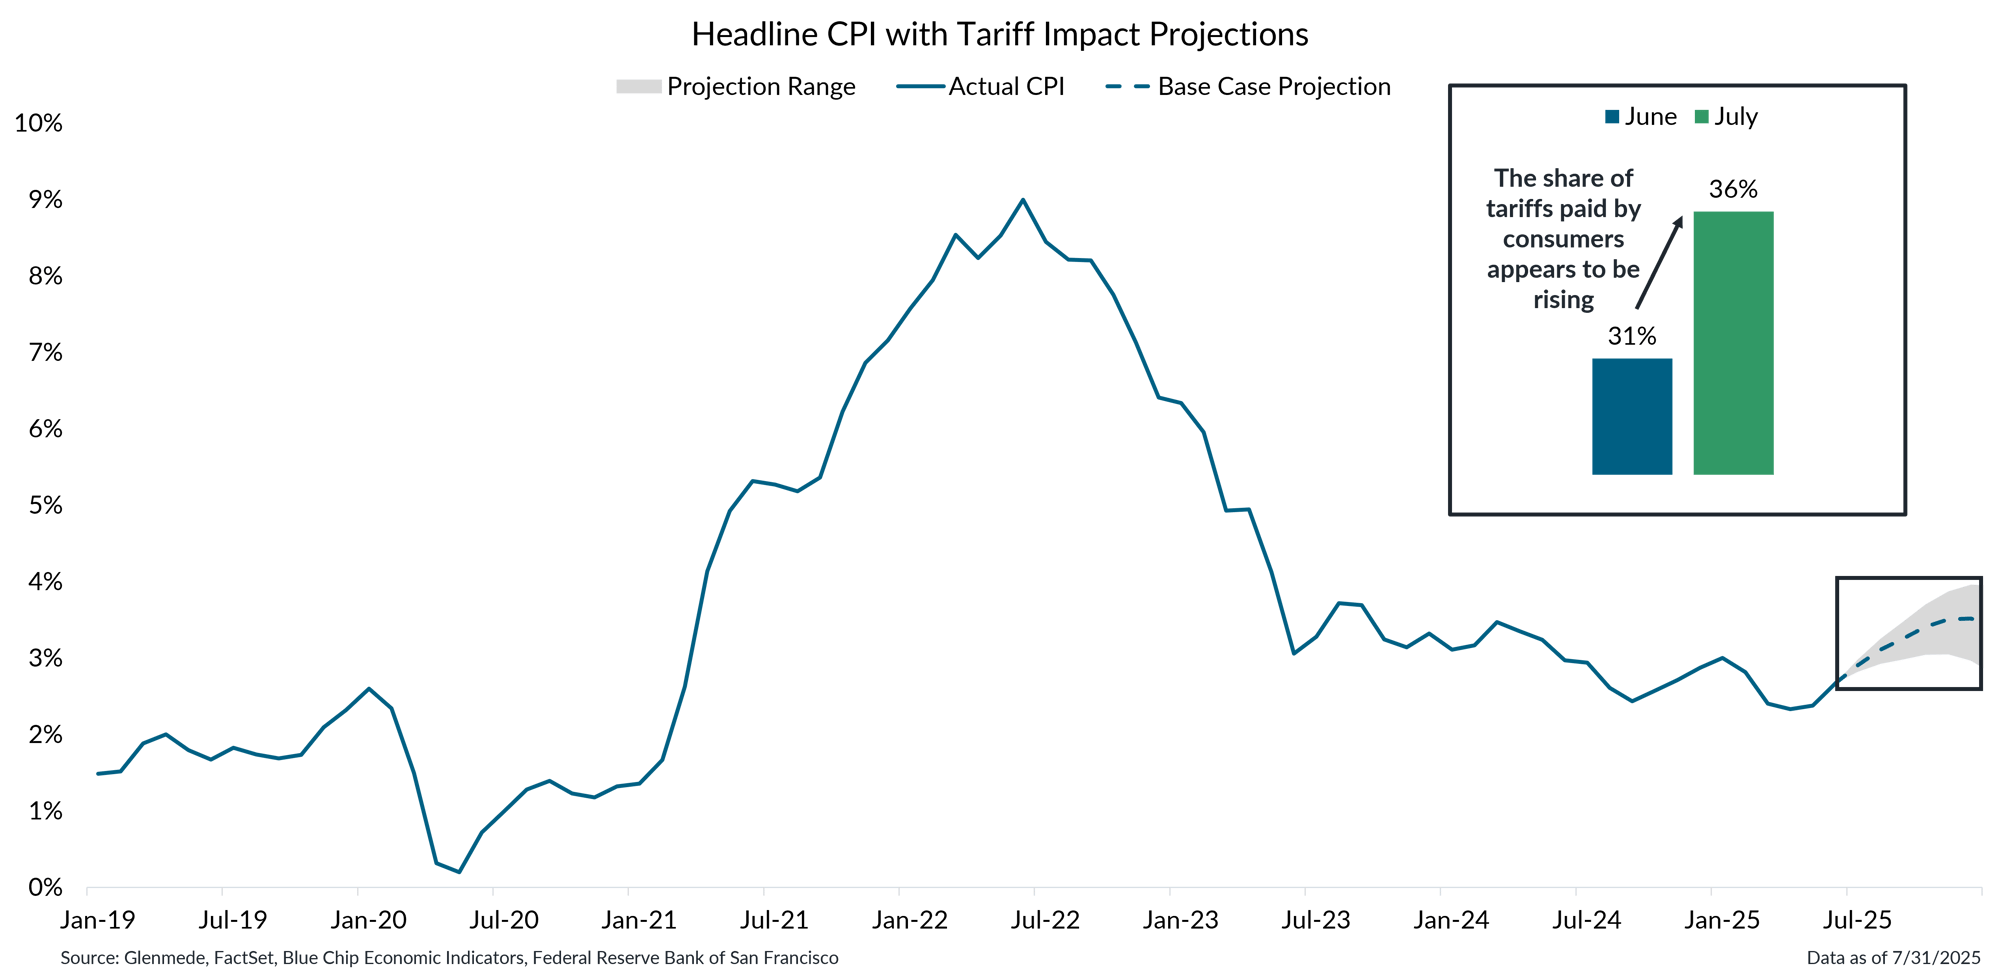
Data shown in blue is year-over-year percent change in the U.S. Consumer Price Index (CPI). The dashed blue line represents Glenmede’s base case projections and the gray region represents a range of plausible outcomes. Projections assume all price increases are passed on to consumers. Data shown in the inset represent the estimated share of consumer goods tariffs effectively paid by consumers during the months shown. Estimates are based on changes in the Consumer Price Index for core goods, applied to total annual consumer goods spending. The values are expressed as a percentage of estimated total annual tariff revenue on consumer goods. Actual results may differ materially from expectations or projections.
- The share of tariffs paid by consumers appears to be rising, as higher core goods prices suggest businesses are beginning to pass on tariff-related cost increases.
- This one-time price adjustment is projected to add between 0.5–1.0% to overall inflation over the coming months, as the effects gradually work their way through the economy.
The Fed is expected to resume cutting rates and end quantitative tightening, loosening financial conditions
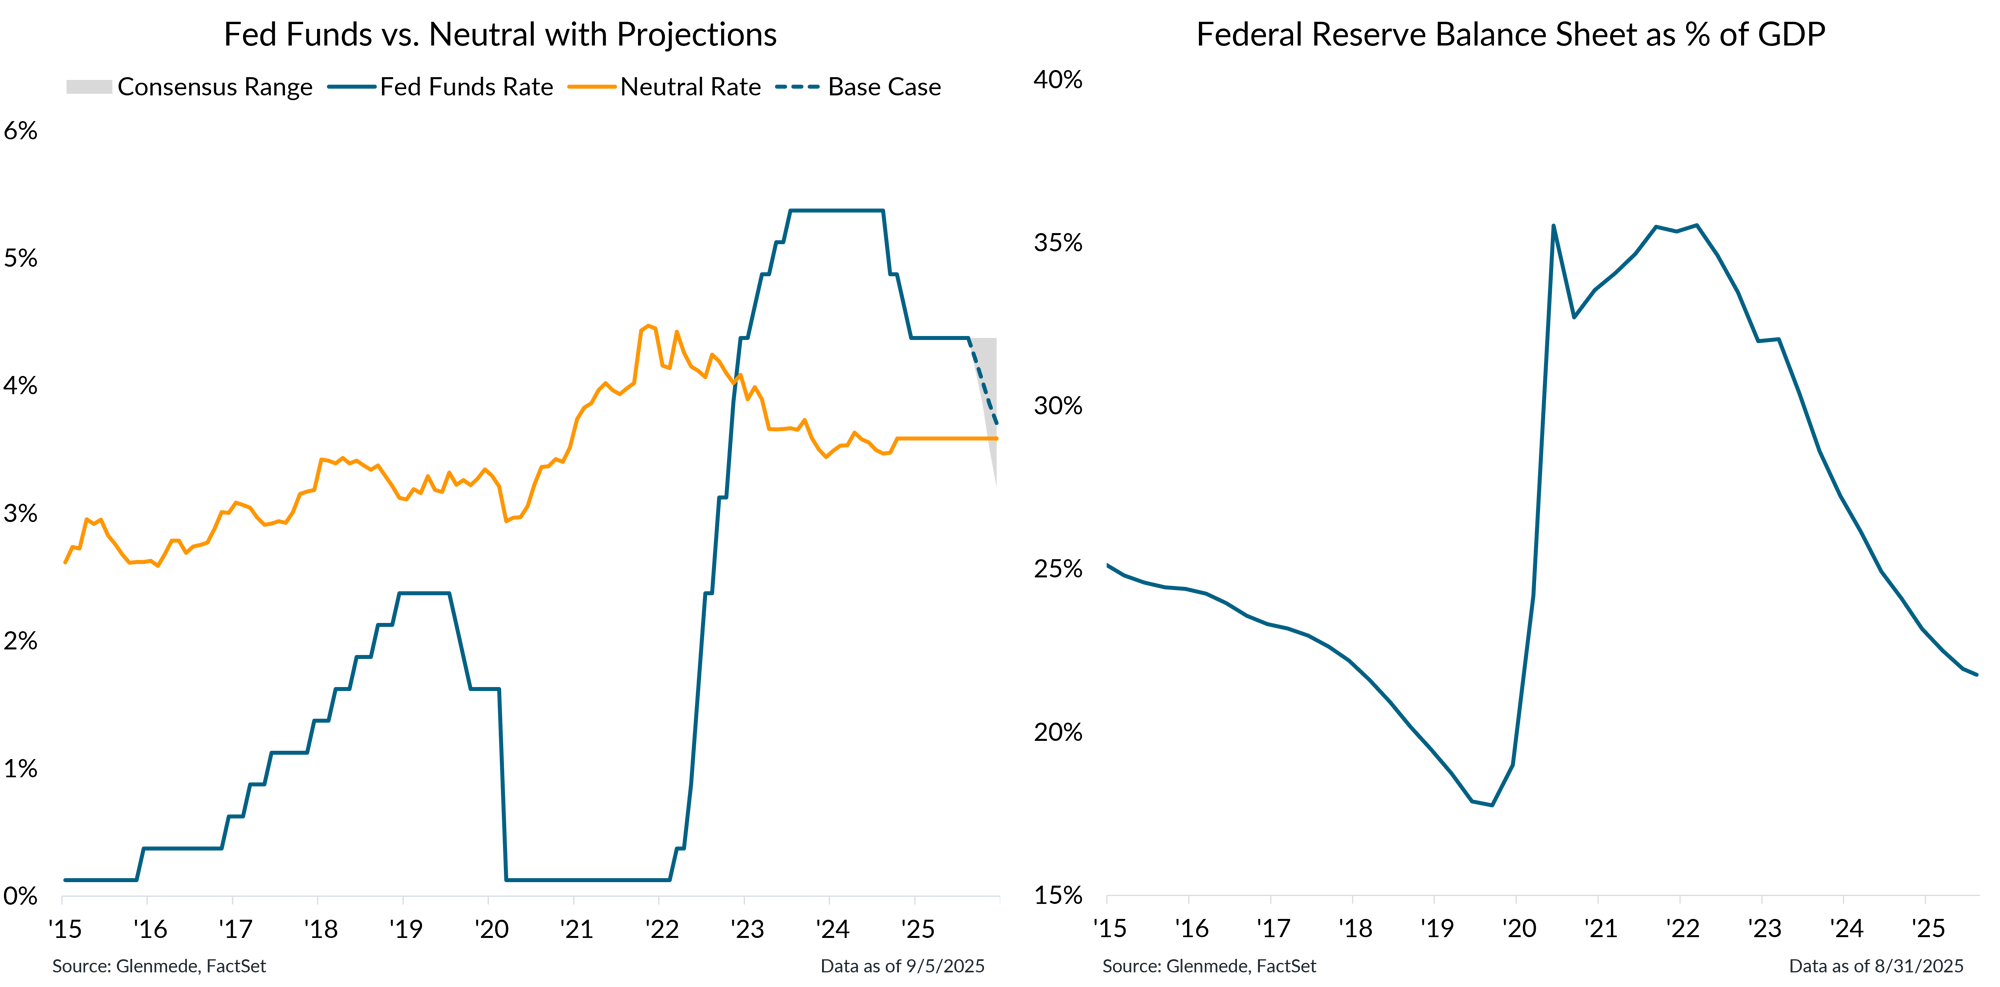
Shown in the left panel in orange are Glenmede’s estimates of the neutral federal funds rate over time (i.e., the level of rates that is neither economically stimulative nor restrictive) based on expectations for real interest rates via the Holston-Laubach-Williams model and Glenmede’s 10yr inflation expectations. Fed Funds Rate in blue is the target rate midpoint. The dashed blue line represents a base case projection based on current pricing in Fed Funds futures and the gray region around that represents a range of plausible outcomes. Shown in the right panel is the Federal Reserve’s balance sheet as a percentage of U.S. gross domestic product (GDP). Actual results may differ materially from projections.
- The Fed is expected to resume its rate cut campaign at the September FOMC meeting, with approximately two to three rate cuts by year end the current base case.
- The central bank is also likely to bring quantitative tightening to an end, stabilizing the size of its balance sheet relative to GDP and helping preserve liquidity in the financial system.
The dollar’s valuation may continue to slowly fade as its interest rate advantage declines
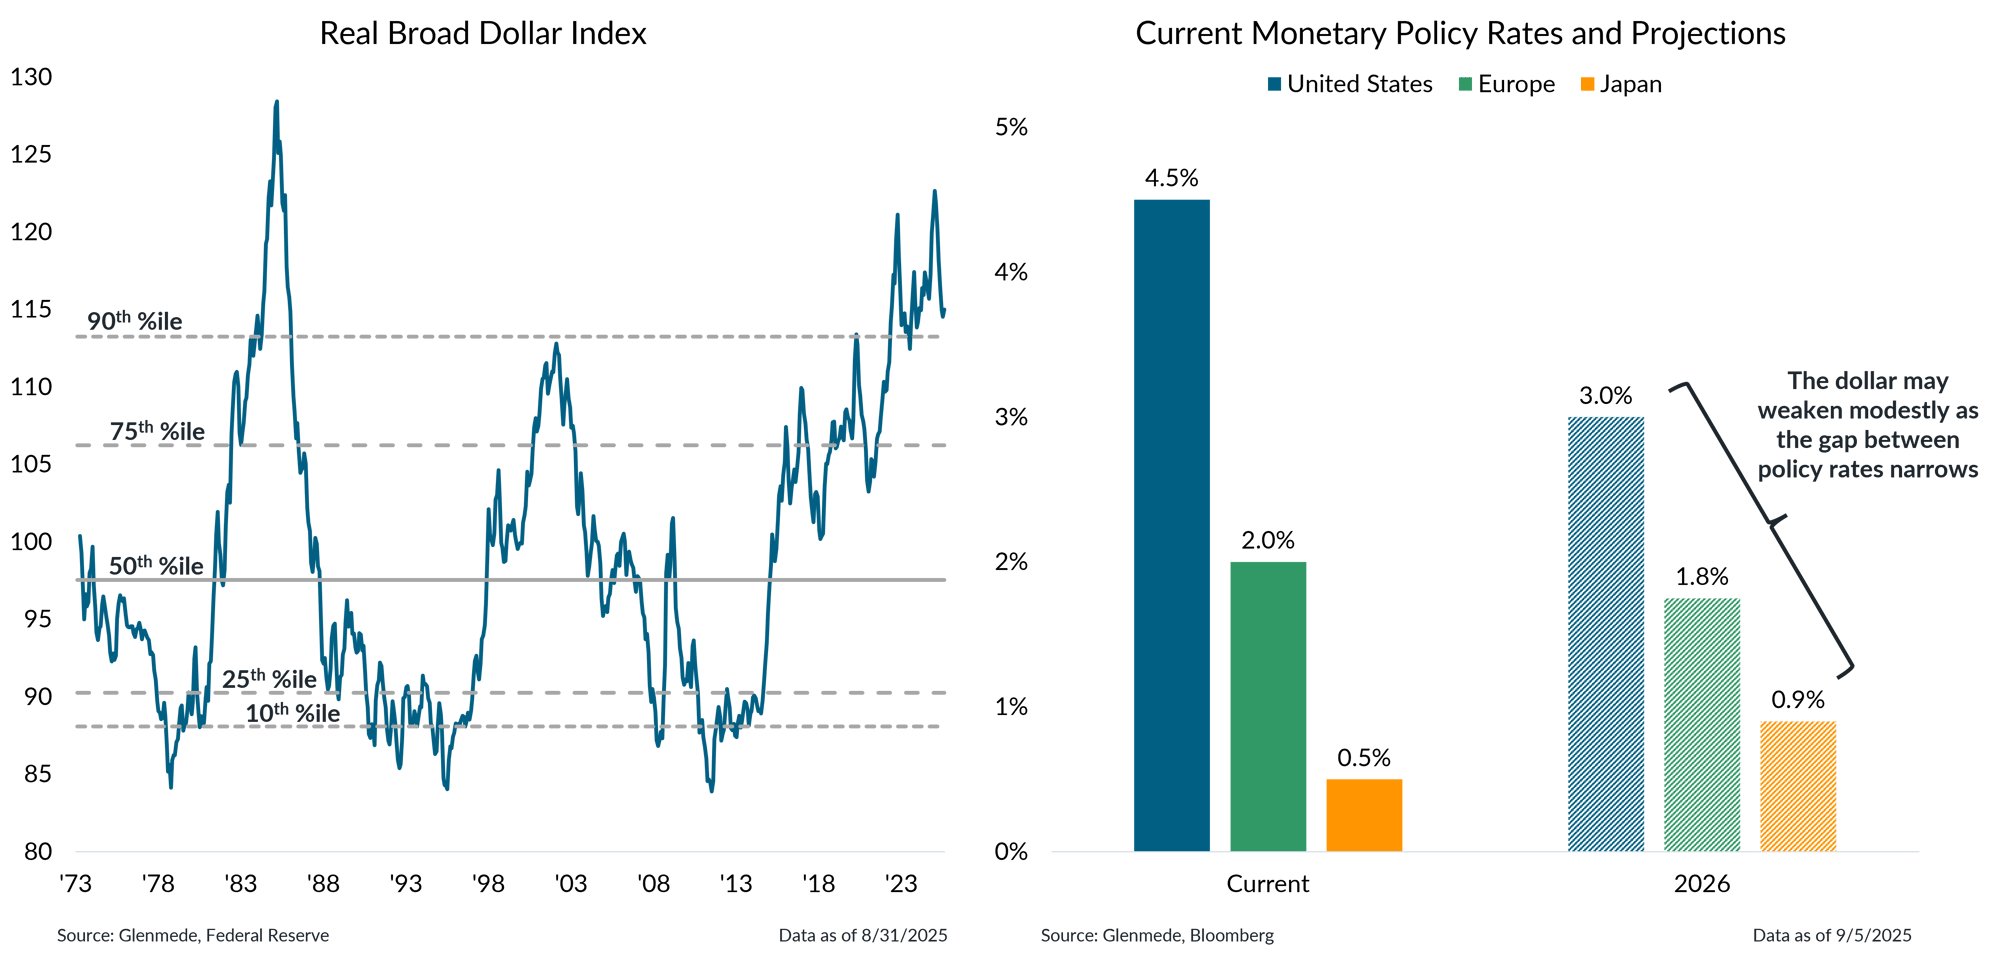
Data shown in the left panel are weighted averages of the foreign exchange value of the U.S. dollar against the currencies of a broad group of major U.S. trading partners, adjusted for inflation to account for purchasing power differentials. Shown in the right panel are upper-bound policy rates for the United States, Europe and Japan. Current rates are shown in solid bars while the median value for a range of estimates for upper-bound rates as of12/31/2026 are shown in hashed bars. Actual results may differ materially from projections.
- The dollar’s strength may gradually weaken as the gap between U.S. monetary policy rates and those of Europe and Japan begins to narrow.
- As this shift unfolds, the dollar’s interest rate advantage will diminish, which may make it somewhat less attractive to global investors.
This material is provided solely for informational and/or educational purposes and is not intended as personalized investment advice. When provided to a client, advice is based on the client’s unique circumstances and may differ substantially from any general recommendations, suggestions or other considerations included in this material. Any opinions, recommendations, expectations or projections herein are based on information available at the time of publication and may change thereafter. Information obtained from third-party sources is assumed to be reliable but may not be independently verified, and the accuracy thereof is not guaranteed. Any company, fund or security referenced herein is provided solely for illustrative purposes and should not be construed as a recommendation to buy, hold or sell it. Outcomes (including performance) may differ materially from any expectations and projections noted herein due to various risks and uncertainties. Any reference to risk management or risk control does not imply that risk can be eliminated. All investments have risk. Clients are encouraged to discuss any matter discussed herein with their Glenmede representative.

