Investment Strategy Brief
Trade Sets Sail Again
May 25, 2025

Executive Summary
- Container ship volumes from China to the U.S. have rebounded after a sharp decline in April.
- Prior tariffs on China were effectively trade prohibitive, but trade appears to be resuming under current rates.
- Higher tariffs have led businesses to seek workarounds to help soften their exposure to price increases.
- Growth expectations have risen from pessimistic levels recently, lowering but not removing recession risks.
- Easing tariff pressures and the rebound in trade flows may help mitigate recession risk in the U.S.
Container ship volumes from China to the U.S. have rebounded after a sharp decline in April
.png?width=2000&height=1021&name=IS%20Brief%202025-05-27%20Chart%201%20(New).png)
Data shown in the left panel represent aggregated container volumes, measured in twenty-foot equivalent units (TEUs), for ships departing from China to the U.S. over a 15-day rolling period. Shown in the right panel are container volumes measured in TEUs booked to travel from China to the U.S.
- Companies accelerated demand earlier this year in an attempt to mitigate the impact of anticipated tariff increases.
- The subsequent implementation of tariffs, particularly the tit-for-tat escalation with China, led to a notable pullback in imports.
- However, following an agreement between the U.S. and China to implement a 90-day pause of reciprocal tariffs, companies have begun resuming container bookings, planning to import goods that were left idle at Chinese ports.
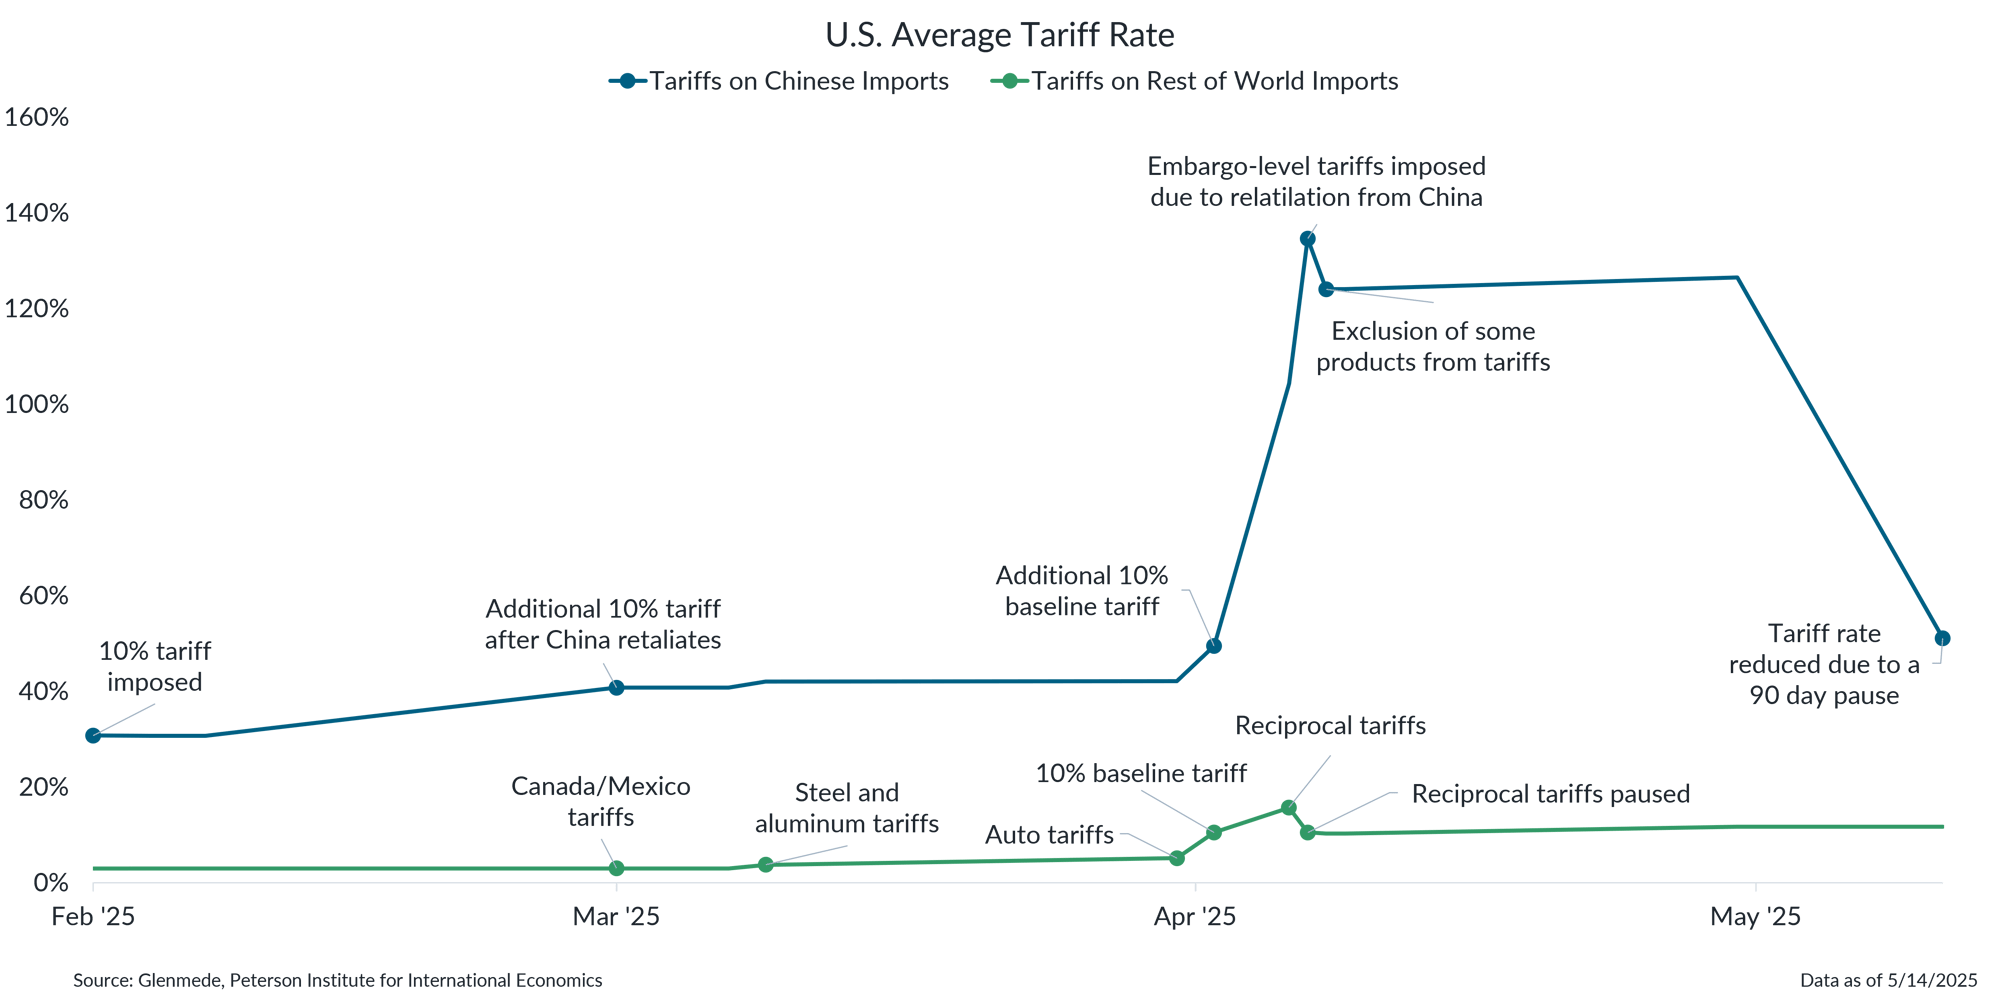
The tariff rate on Chinese imports has decreased from near-embargo levels

Shown in blue are the average tariff rates on U.S. imports from China, and in green are the rates on imports from the rest of the world. The effective tariff rate includes nominal tariffs on final goods as well as on imported inputs used in production.
- For most of April, 100%+ tariffs on Chinese imports were effectively trade prohibitive.
- The recent de-escalation has returned tariff rates between the world’s two largest economies to a lower level that should help alleviate a significant hurdle for cross-Pacific trade.
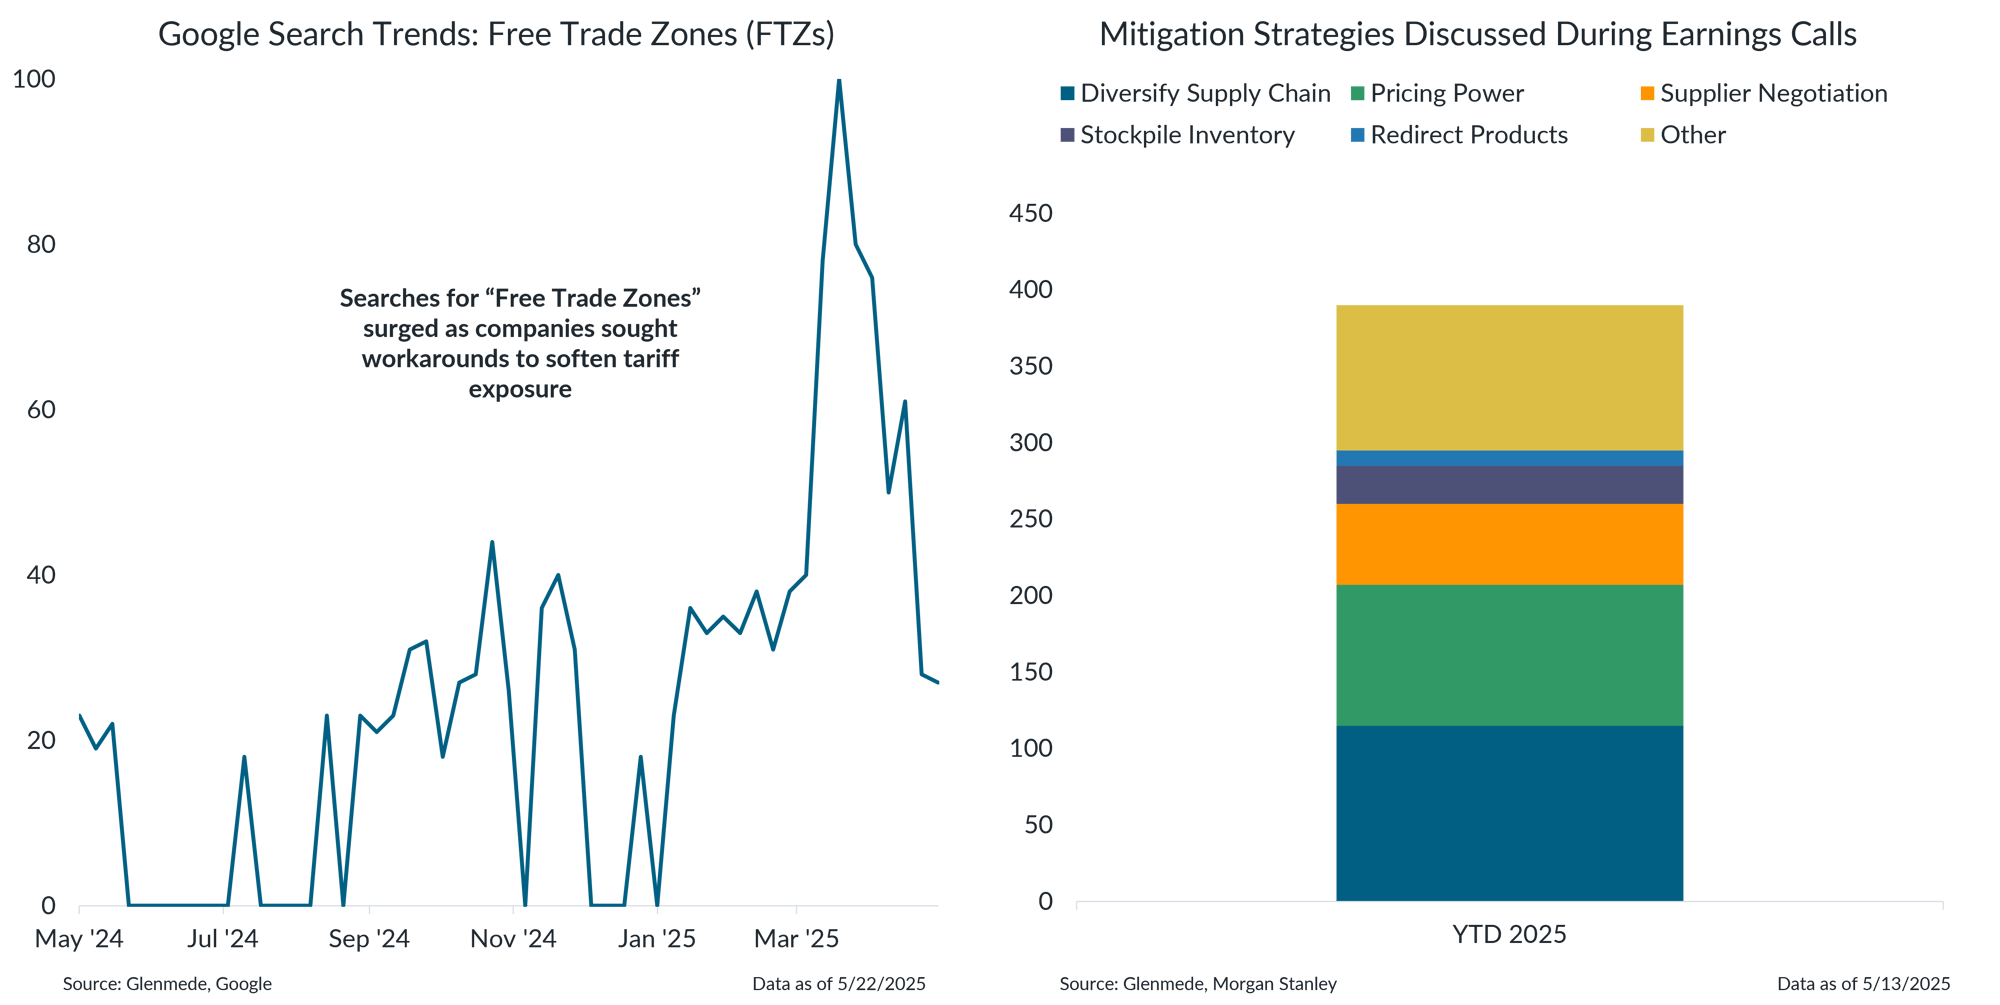
Higher tariffs have led businesses to seek workarounds to help soften their exposure to price increases

Shown in the left panel is Google search interest in “Free Trade Zone” over time; a value of 100 represents peak search popularity over the selected time period. Shown in the right panel are the number of companies that mentioned various mitigation strategies during their Q1 2025 earnings calls.
- Companies have started to seek ways to mitigate the impact of tariffs, including exploring free trade zones, which allow goods to be imported, stored and processed without immediate payment of tariffs.
- Other mitigation strategies discussed by companies this earnings season included diversifying supply chains, exercising pricing power, negotiating with suppliers, stockpiling inventory and redirecting products.
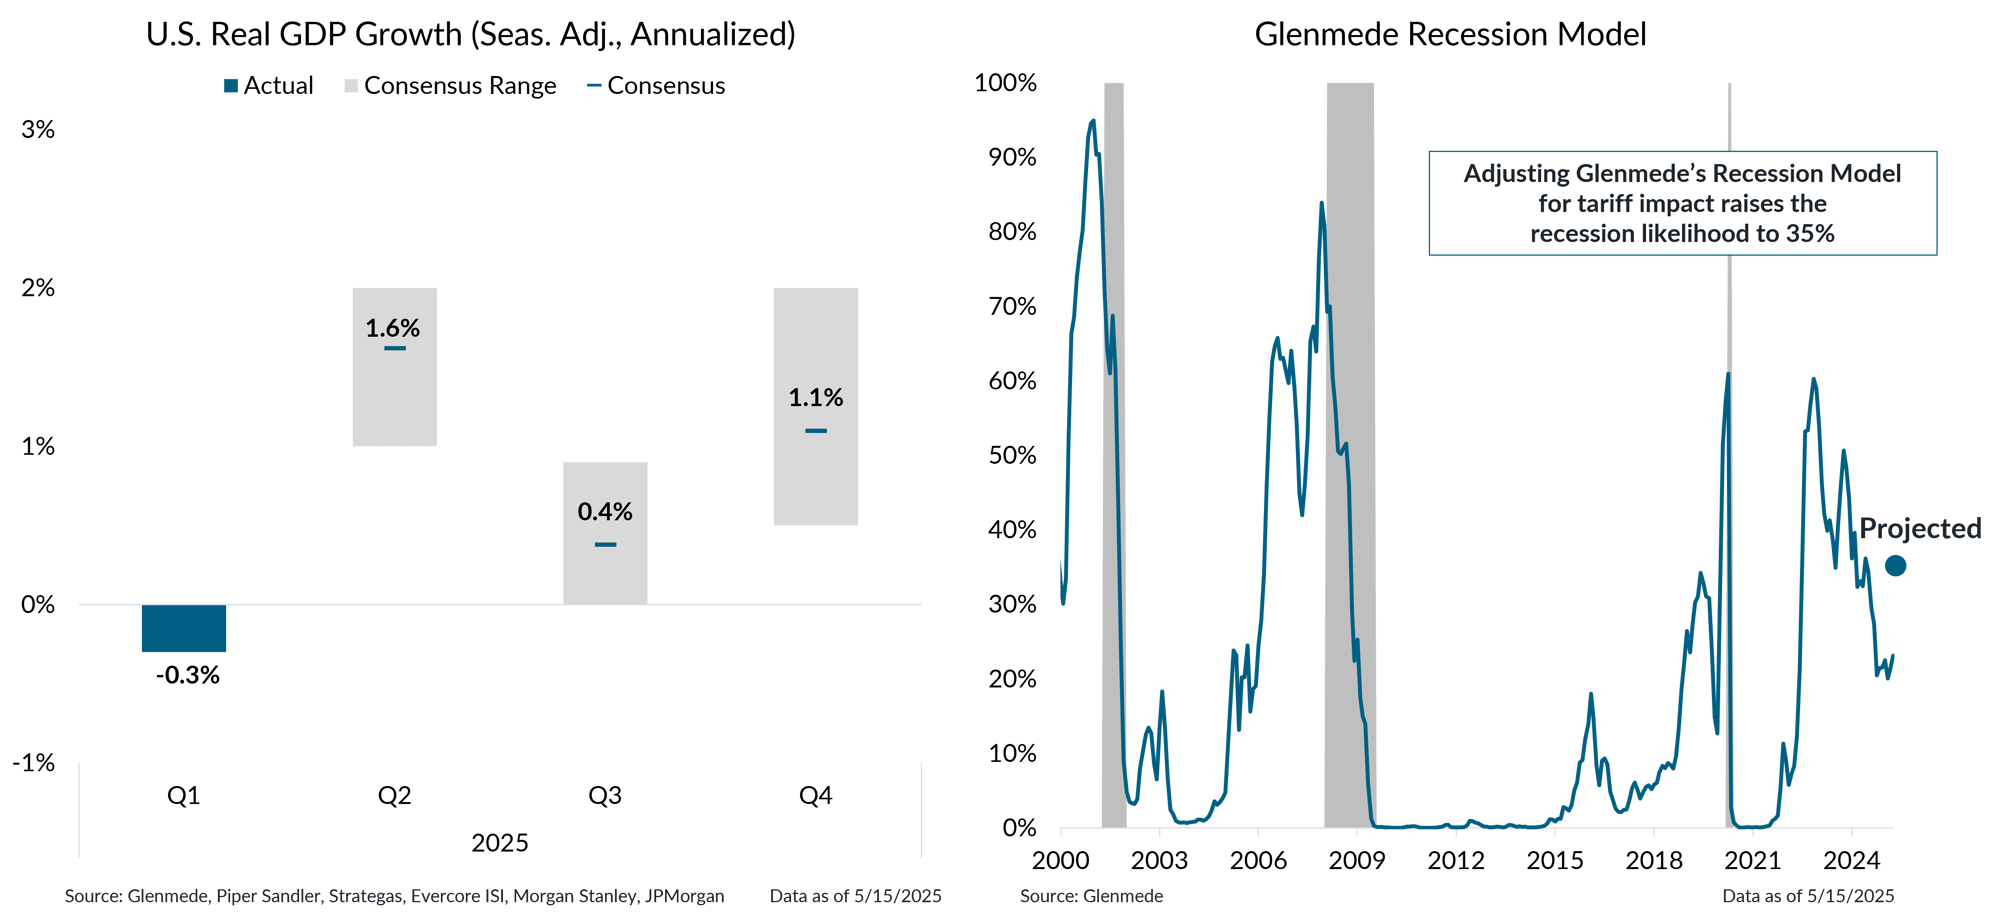
Growth expectations have risen from pessimistic levels, lowering but not removing recession risks

Shown in the left panel in gray is a range of estimates from economists for quarterly U.S. real gross domestic product (GDP) growth on a seasonally adjusted annualized basis. Solid blue figures are actual results. The blue dashes represent the average of estimates. Shown in the right panel is Glenmede’s Recession Model, a tool developed by Glenmede to estimate the probability of a recession in the U.S. occurring within the next 12 months. The model is a balanced mix of (1) long-term excess indicators covering manufacturing, employment and debt balances and (2) near-term leading indicators covering monetary policy, credit markets, business sentiment and other economic trends. Shaded areas represent recession periods of the U.S. economy. Though created in good faith, there can be no guarantee that these indicators will be accurate. The model was established in 2015. The data shown for prior periods represent backtested results. Actual results may differ materially from expectations.
- Economic growth prospects for the second half of 2025 have improved, with below-trend but still positive real GDP growth the new base case.
- This is driven by shifting expectations around trade policy impacts and the administration's increased willingness to negotiate with key trading partners.
- Glenmede’s Recession Model now estimates a more modest 35% probability of a recession in the next 12 months, as easing tariff pressures and the rebound in trade flows may help mitigate the risk of an economic downturn.
This material is intended to review matters of possible interest to Glenmede Trust Company clients and friends and is not intended as personalized investment advice. When provided to a client, advice is based on the client’s unique circumstances and may differ substantially from any general recommendations, suggestions or other considerations included in this material. Any opinions, recommendations, expectations or projections herein are based on information available at the time of publication and may change thereafter. Information obtained from third-party sources is assumed to be reliable but may not be independently verified, and the accuracy thereof is not guaranteed. Outcomes (including performance) may differ materially from any expectations and projections noted herein due to various risks and uncertainties. Any reference to risk management or risk control does not imply that risk can be eliminated. All investments have risk. Clients are encouraged to discuss any matter discussed herein with their Glenmede representative.

Feature one
Use text and images to tell your company’s story. Explain what makes your product or service extraordinary.

Feature two
Use text and images to tell your company’s story. Explain what makes your product or service extraordinary.

Feature three
Use text and images to tell your company’s story. Explain what makes your product or service extraordinary.

