Investment Strategy Brief
Trump 2.0: New Terms of Trade
February 3, 2025
Executive Summary
- Trade negotiations appear fluid, but the 25% Canada/Mexico and 10% China levies represent a step function higher in U.S. tariff policy.
- If permanent, tariffs to be implemented in Trump’s second term are already likely to have a larger economic impact than in his first.
- Outright deflation in goods has helped ease inflation, but tariffs may threaten this trend.
- While new tariffs are a headwind to economic growth and a tailwind for inflation, they are unlikely to tip the U.S. into recession.
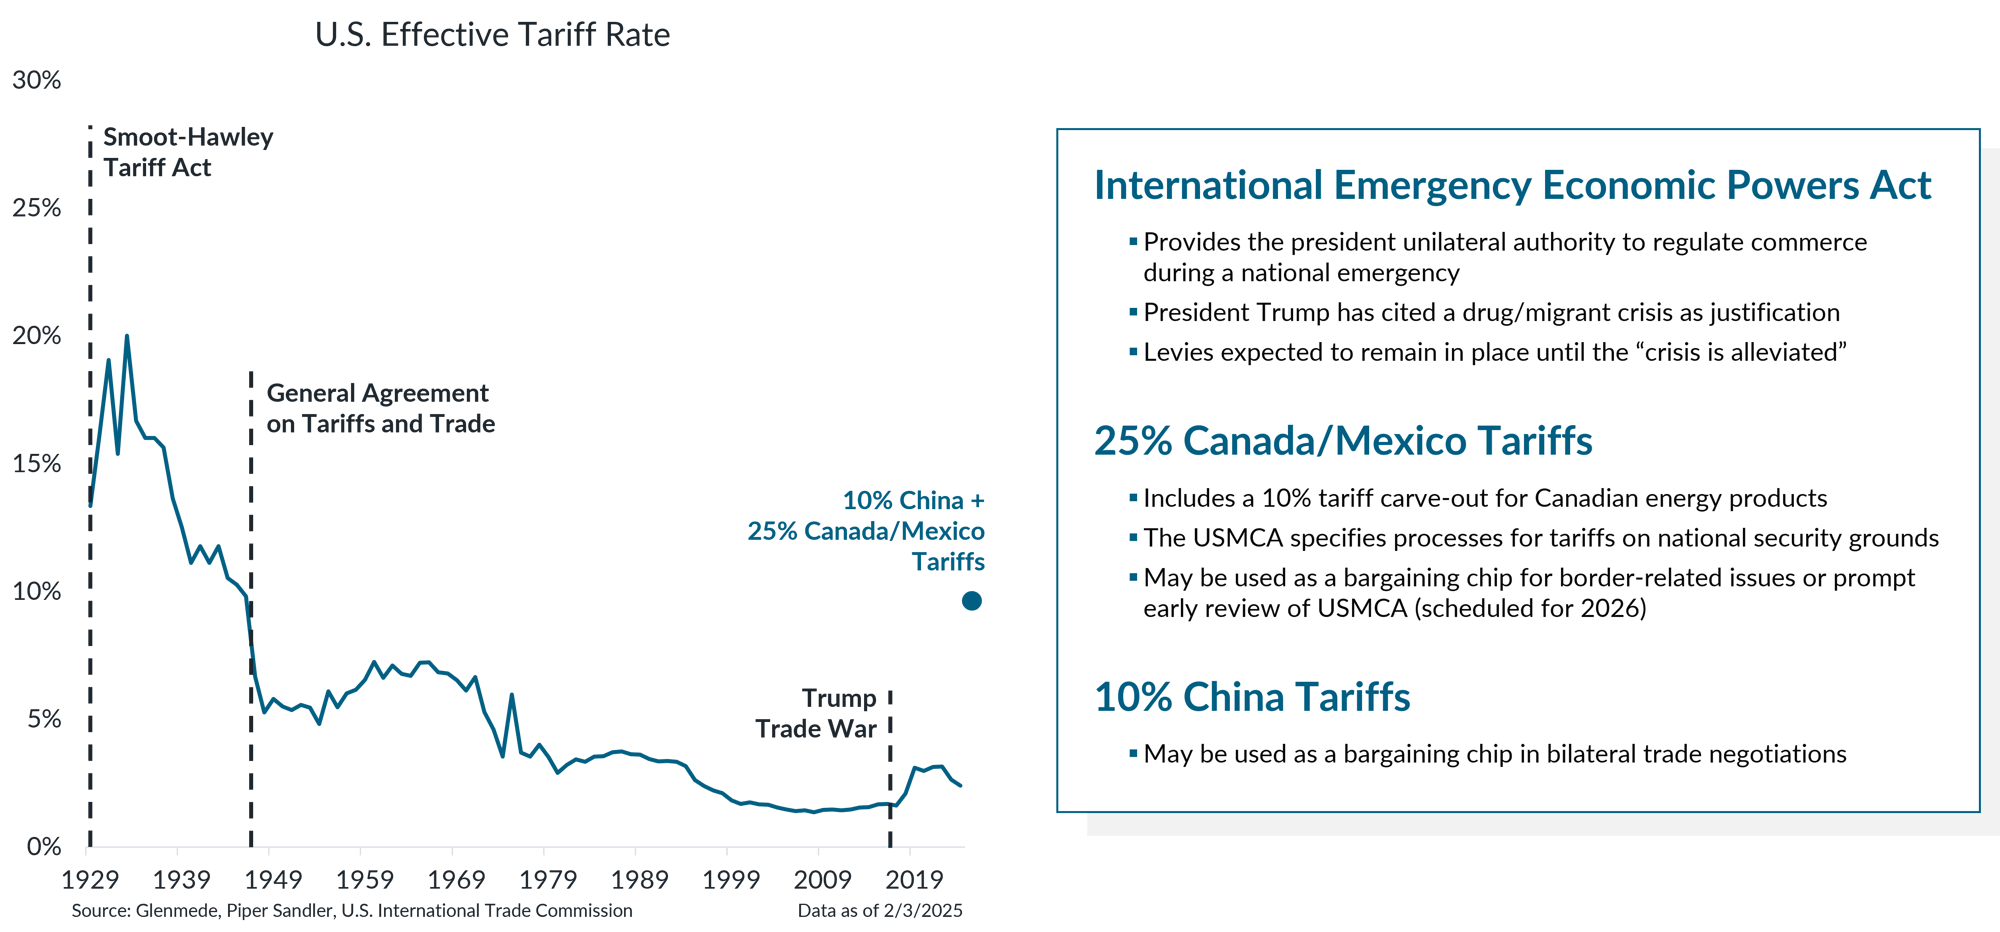
Trade actions in line for implementation this week are a step function higher in effective tariff rates

Data shown in the left panel are effective tariff rates on U.S. imports over time, which includes nominal tariffs on final goods as well as on imported inputs used in production. The dot is a projection for the effective tariff rate assuming tariffs on China are raised 10% and tariffs on Canada and Mexico are raised 25% (with 10% tariffs for Canadian energy imports). The International Emergency Economic Powers Act of 1977 authorizes the president to regulate international commerce after declaration of a national emergency or in response to threats to the U.S. USMCA refers to the U.S.-Mexico-Canada Agreement. Actual results may differ materially from projections.
- Since Canada, Mexico and China collectively represent such a large share of U.S. imports, these trade actions alone may almost quintuple the effective tariff rate on all goods inbound to the U.S. to levels last seen in the 1940s.
- Exports to the U.S. represent approximately 20%, 26% and 3% of all economic activity for Canada, Mexico and China, respectively.
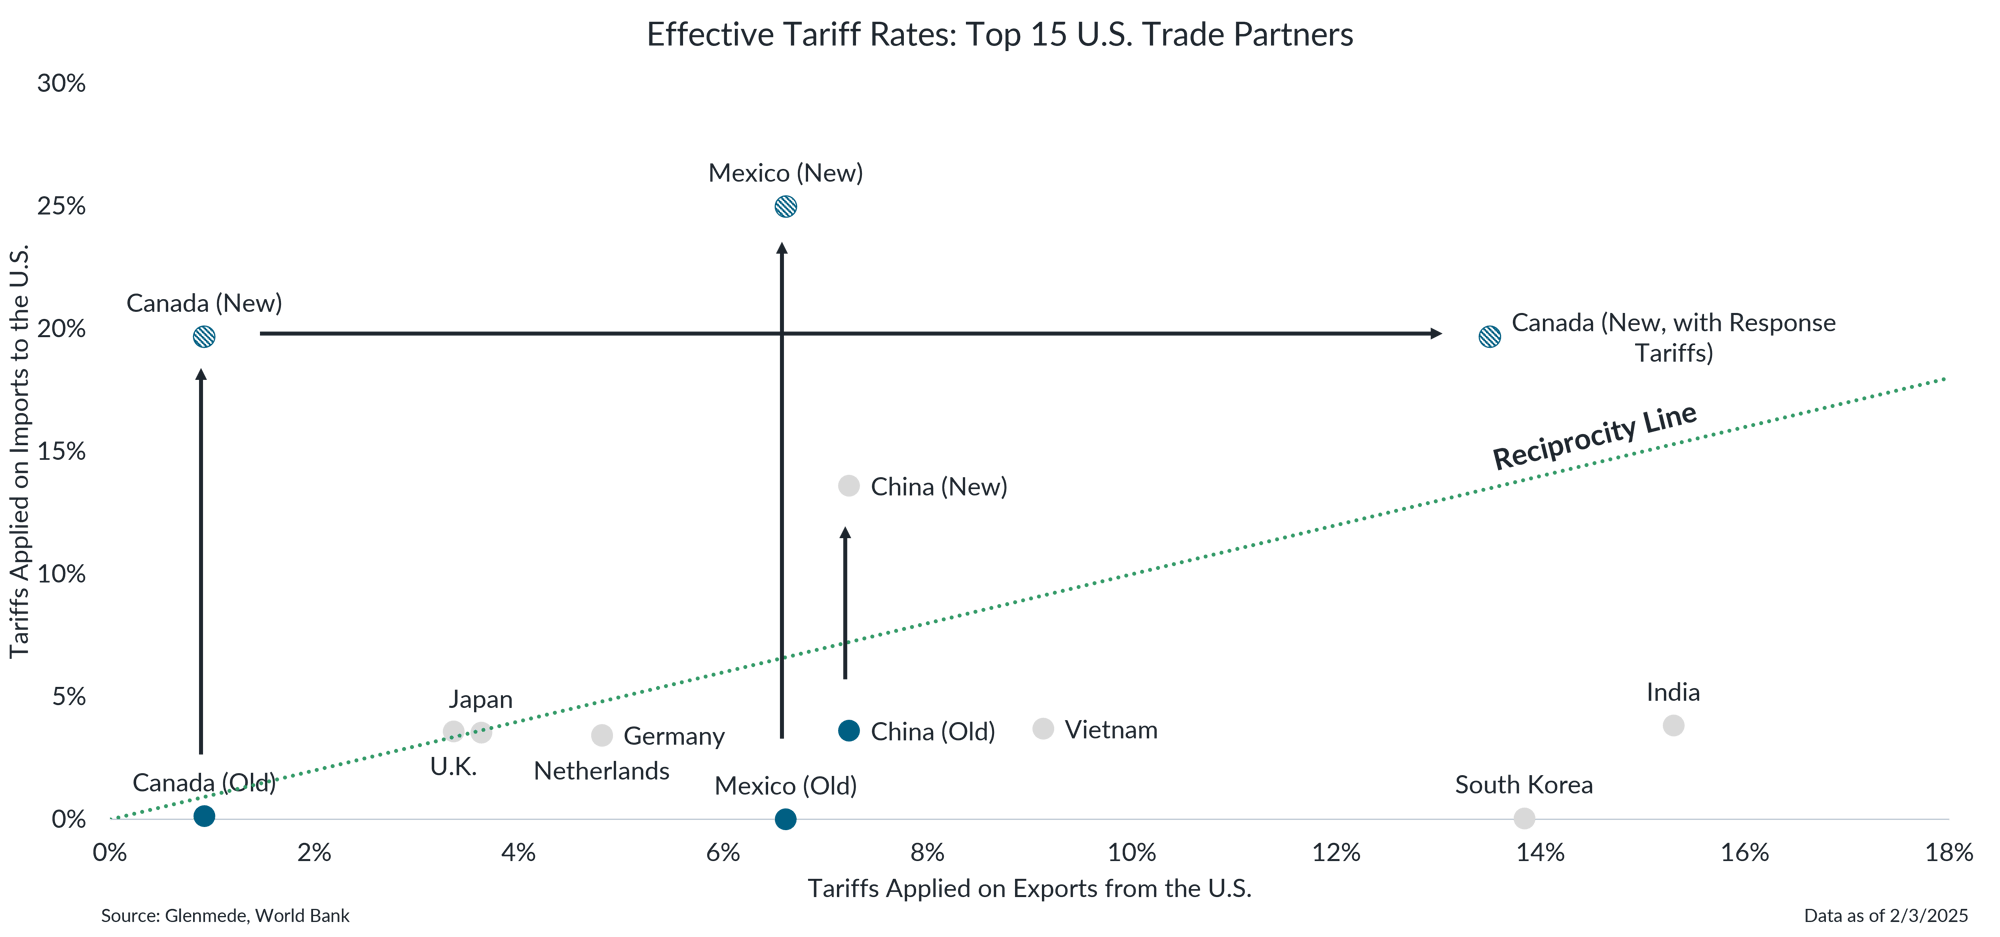
Proposed tariffs appear to swing the pendulum from one side of reciprocity to the other

Data shown are effective tariff rates between the U.S. and the top 10 countries by amounts of goods and services exchanged in the trade relationship (i.e., sum of imports and exports). Graphed along the x-axis are effective tariff rates that apply to U.S. exports to each country and graphed along the y-axis are effective tax rates that the U.S. applies to imports from each country. The dashed green line is the reciprocity line, on which effective tariff rates on both axes are equal. Solid blue dots for Canada, Mexico and China are before the tariff increases scheduled to go into effect on 2/4/2025, including Canada’s response of 25% tariffs on $155 billion of U.S. goods. The hashed blue dots are the expected level of effective tariffs after the scheduled tariff increases. Actual results may differ materially from expectations.
- An oft-cited justification for tariffs is the relative imbalance in tariff reciprocity between the U.S. and its major trade partners, as most charge higher tariffs on U.S. products than the U.S. does on theirs.
- The tariffs scheduled to go into effect appear to swing the pendulum from one side of reciprocity to the other, though the terms of trade may be volatile in the weeks ahead as other countries respond.
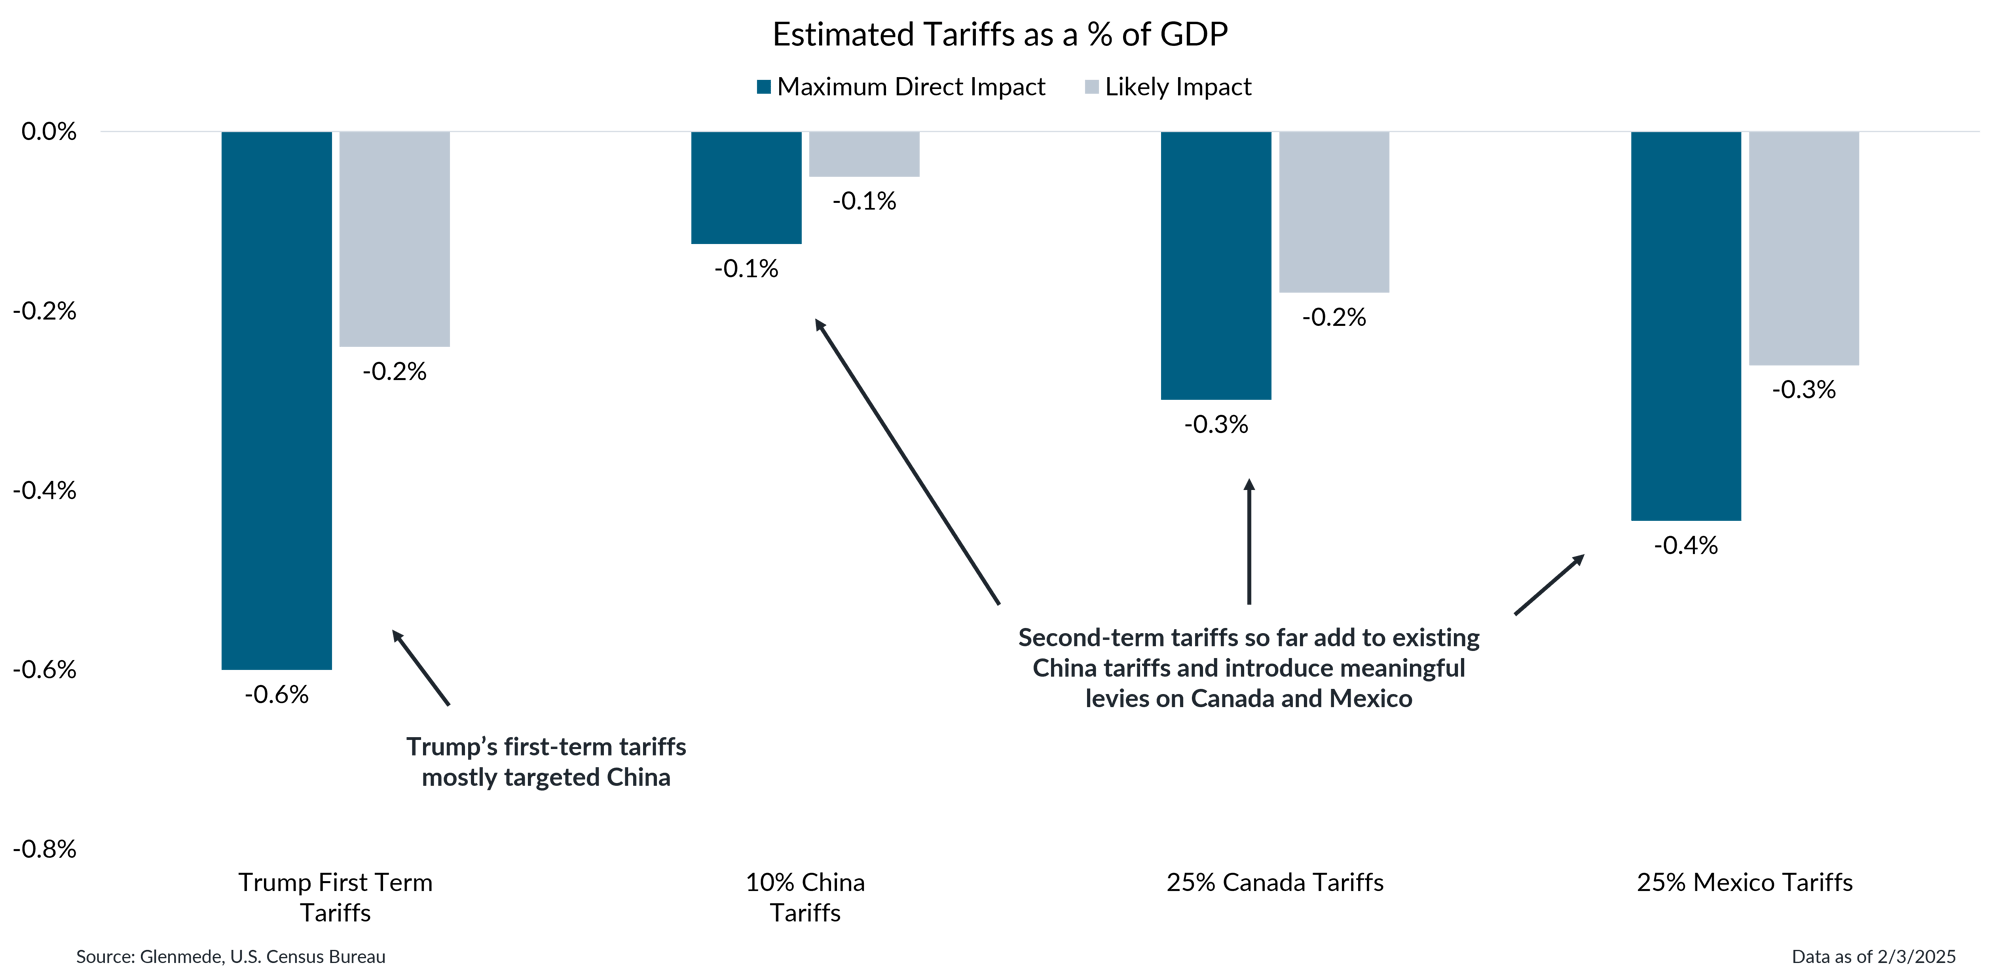
If permanent, tariffs implemented in Trump’s second term are already likely to have a larger economic impact

Estimated tariffs reflect the tariff rate applied fully to all associated imports and are shown as a percent of gross domestic product (GDP). 25% Canada Tariffs includes a carveout for energy products, for which 10% tariffs apply. The maximum direct economic impact of proposed tariffs assumes full demand destruction via a tariff-induced price shock and that tariffs are implemented fully and in isolation, with no changes to the sourcing of the imports, no other offsetting policies and no retaliatory tariffs. Likely impact accounts for offsetting factors such as reconfigured supply chains and substitution effects. Actual results may differ materially from expectations or projections.
- Glenmede estimates that the cumulative impact of Trump’s first term tariffs was a roughly 0.2% headwind to economic growth.
- Given the difficulty of tariff avoidance from trade partners with which the U.S. shares a border, the tariffs scheduled to go into effect tomorrow may be a roughly 0.5% headwind to economic growth.
- All else equal, these new tariffs are unlikely to tip the U.S. into recession. However, this is likely to be a much more meaningful headwind to the Canadian and Mexican economies.
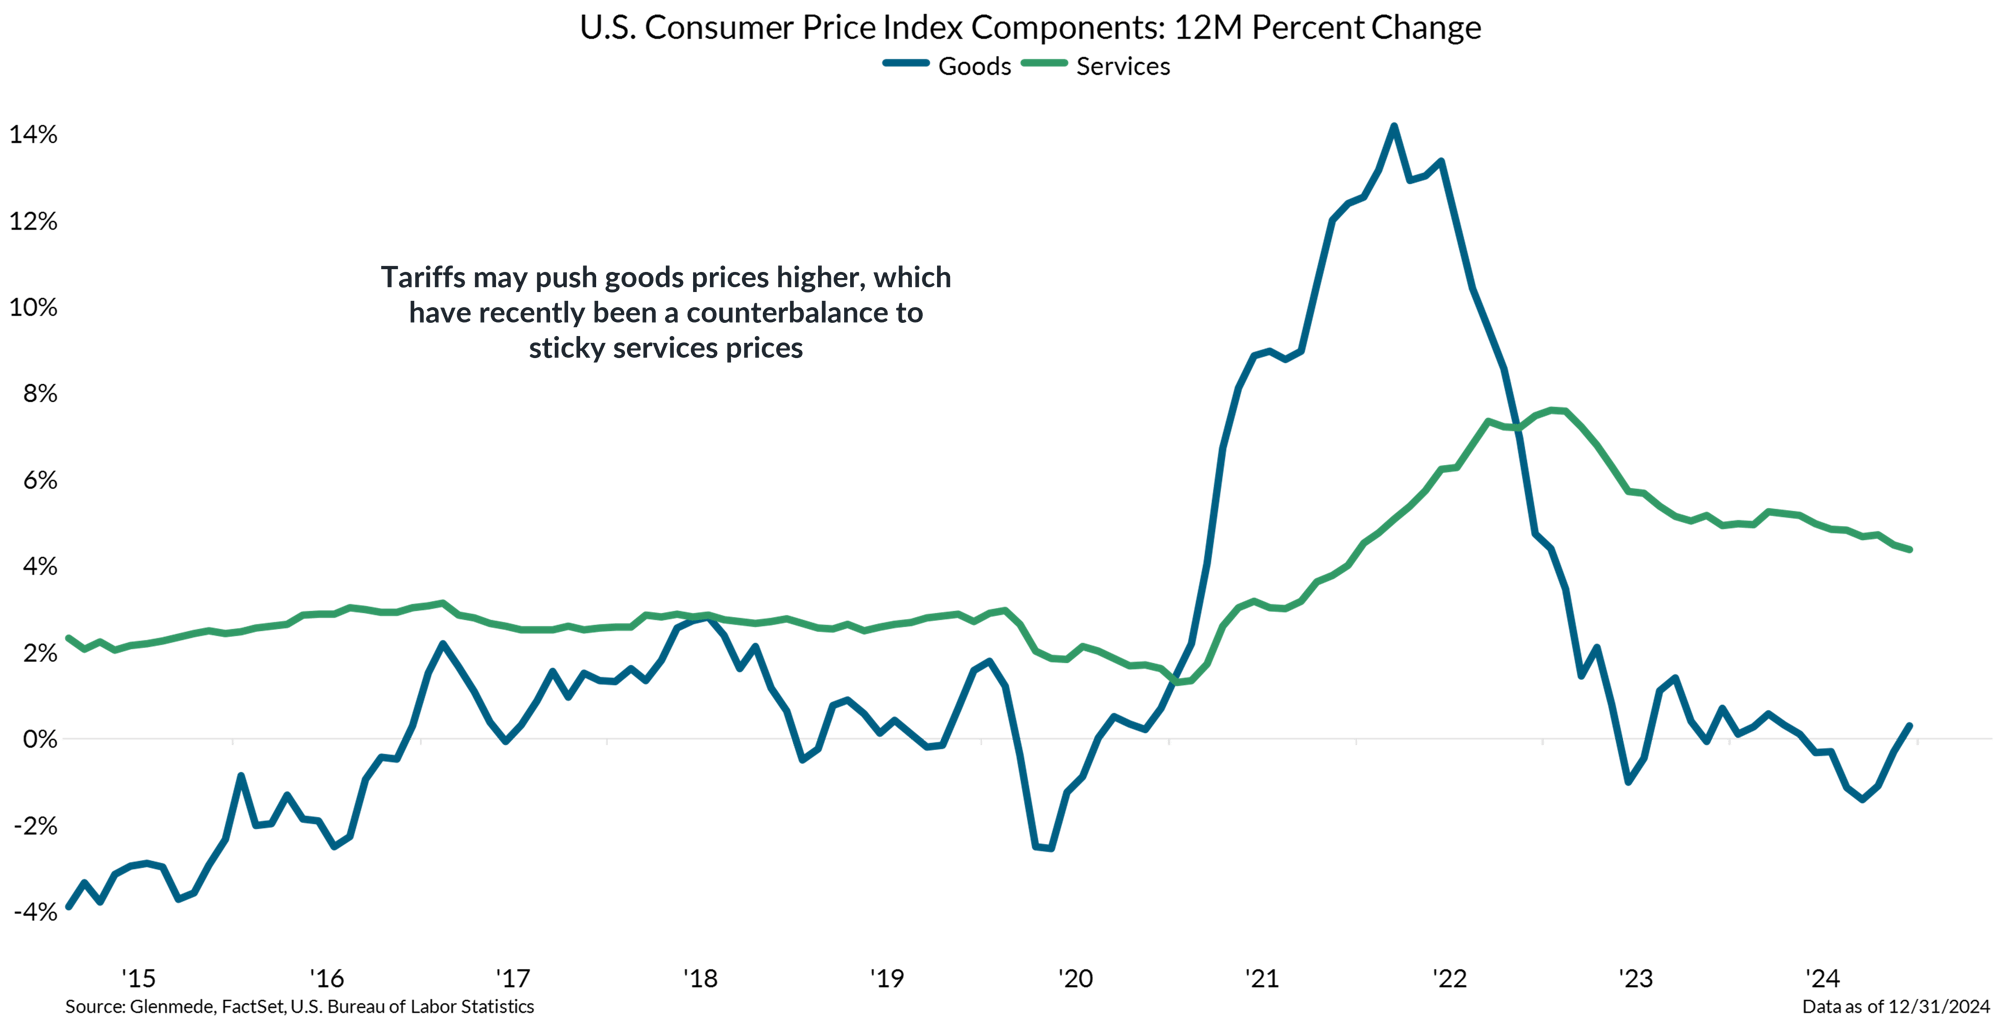
Outright deflation in goods has helped ease inflation, but tariffs may threaten this trend

Data shown are the 12-month percent changes in the U.S. Consumer Price Index (CPI) components for Commodities (Goods) and Services. CPI measures the price of a basket of goods & services consumed by U.S. households.
- Core goods (i.e., excluding food and energy) have been a key deflationary force as the Consumer Price Index has flirted with reacceleration, but tariffs may put recent progress at risk.
- Things to watch include prices for petroleum products and motor vehicles/parts, which are among the top imports from Canada, Mexico and China.
This material is intended to review matters of possible interest to Glenmede Trust Company clients and friends and is not intended as personalized investment advice. When provided to a client, advice is based on the client’s unique circumstances and may differ substantially from any general recommendations, suggestions or other considerations included in this material. Any opinions, recommendations, expectations or projections herein are based on information available at the time of publication and may change thereafter. Information obtained from third-party sources is assumed to be reliable but may not be independently verified, and the accuracy thereof is not guaranteed. Outcomes (including performance) may differ materially from any expectations and projections noted herein due to various risks and uncertainties. Any reference to risk management or risk control does not imply that risk can be eliminated. All investments have risk. Clients are encouraged to discuss any matter discussed herein with their Glenmede representative.

Feature one
Use text and images to tell your company’s story. Explain what makes your product or service extraordinary.

Feature two
Use text and images to tell your company’s story. Explain what makes your product or service extraordinary.

Feature three
Use text and images to tell your company’s story. Explain what makes your product or service extraordinary.

