Investment Strategy Brief
Who Pays the Tariff Tab?
August 3, 2025

Executive Summary
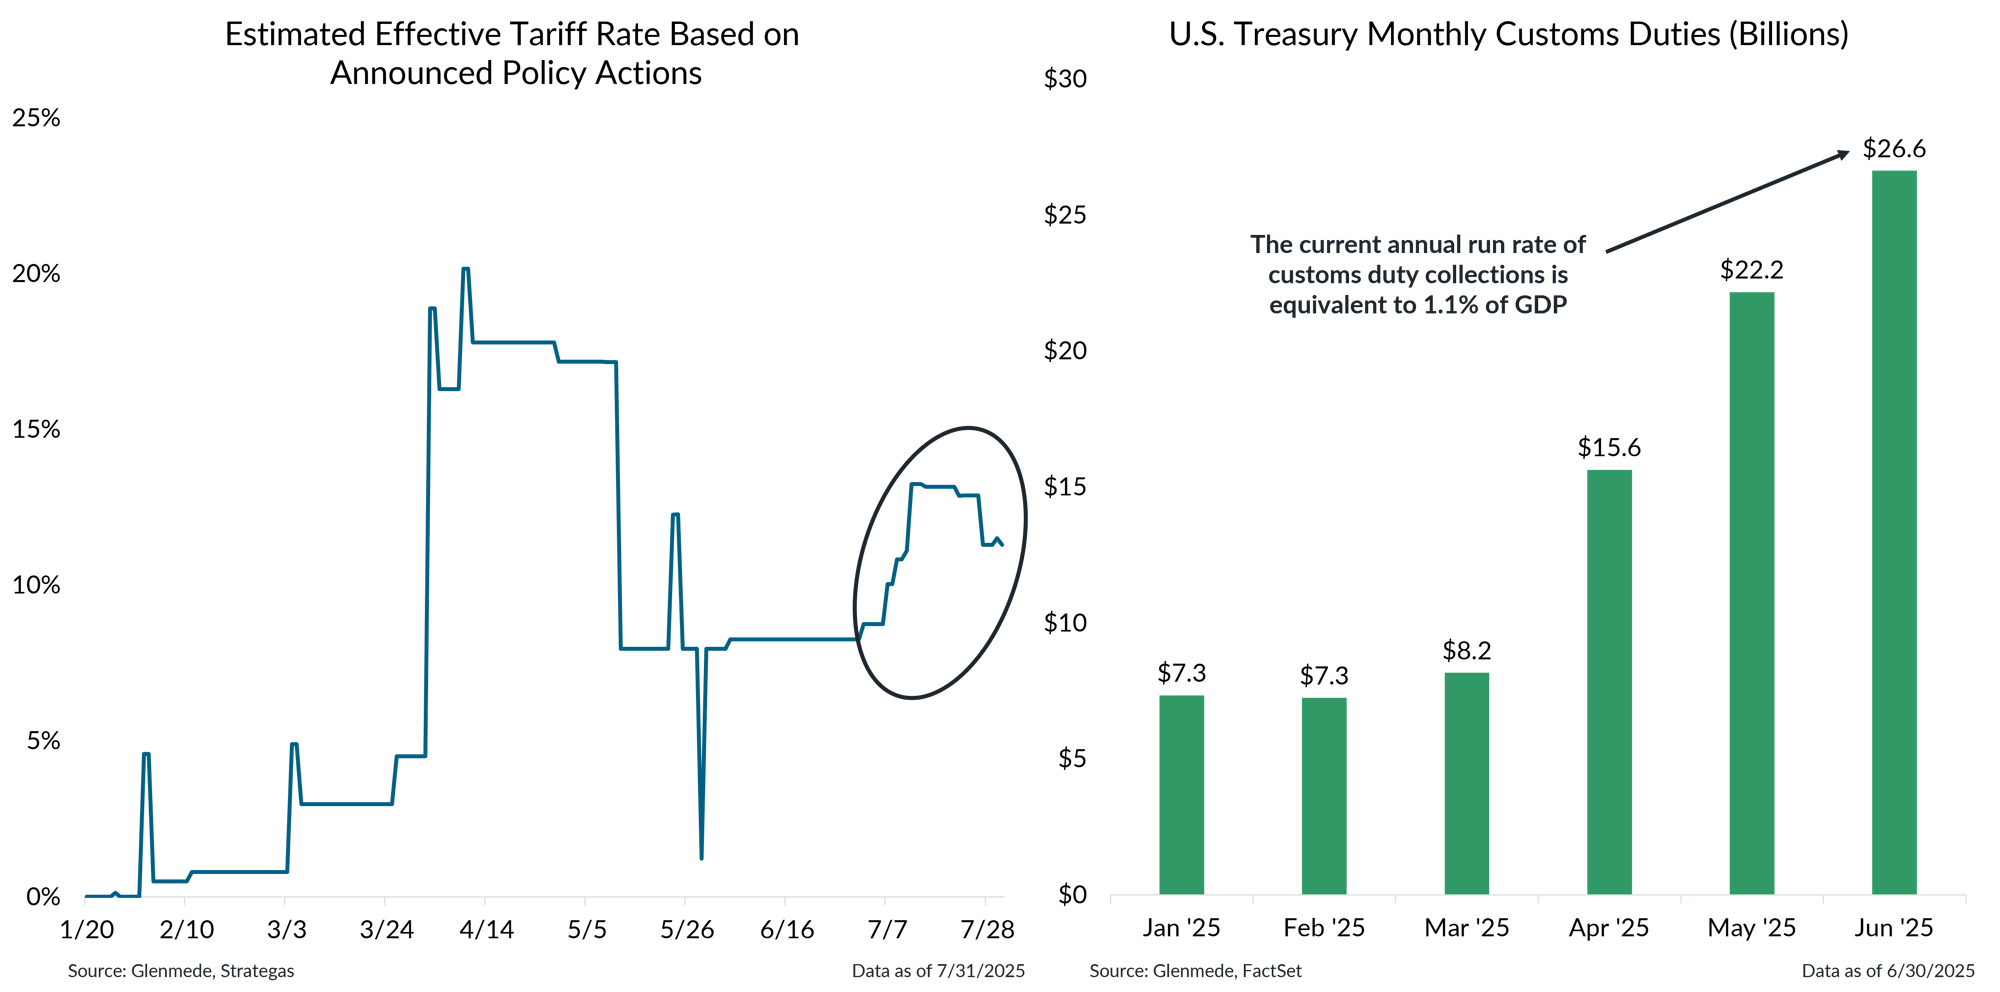
- As tariff policies are implemented, collected duties have grown to nearly 1% of GDP.
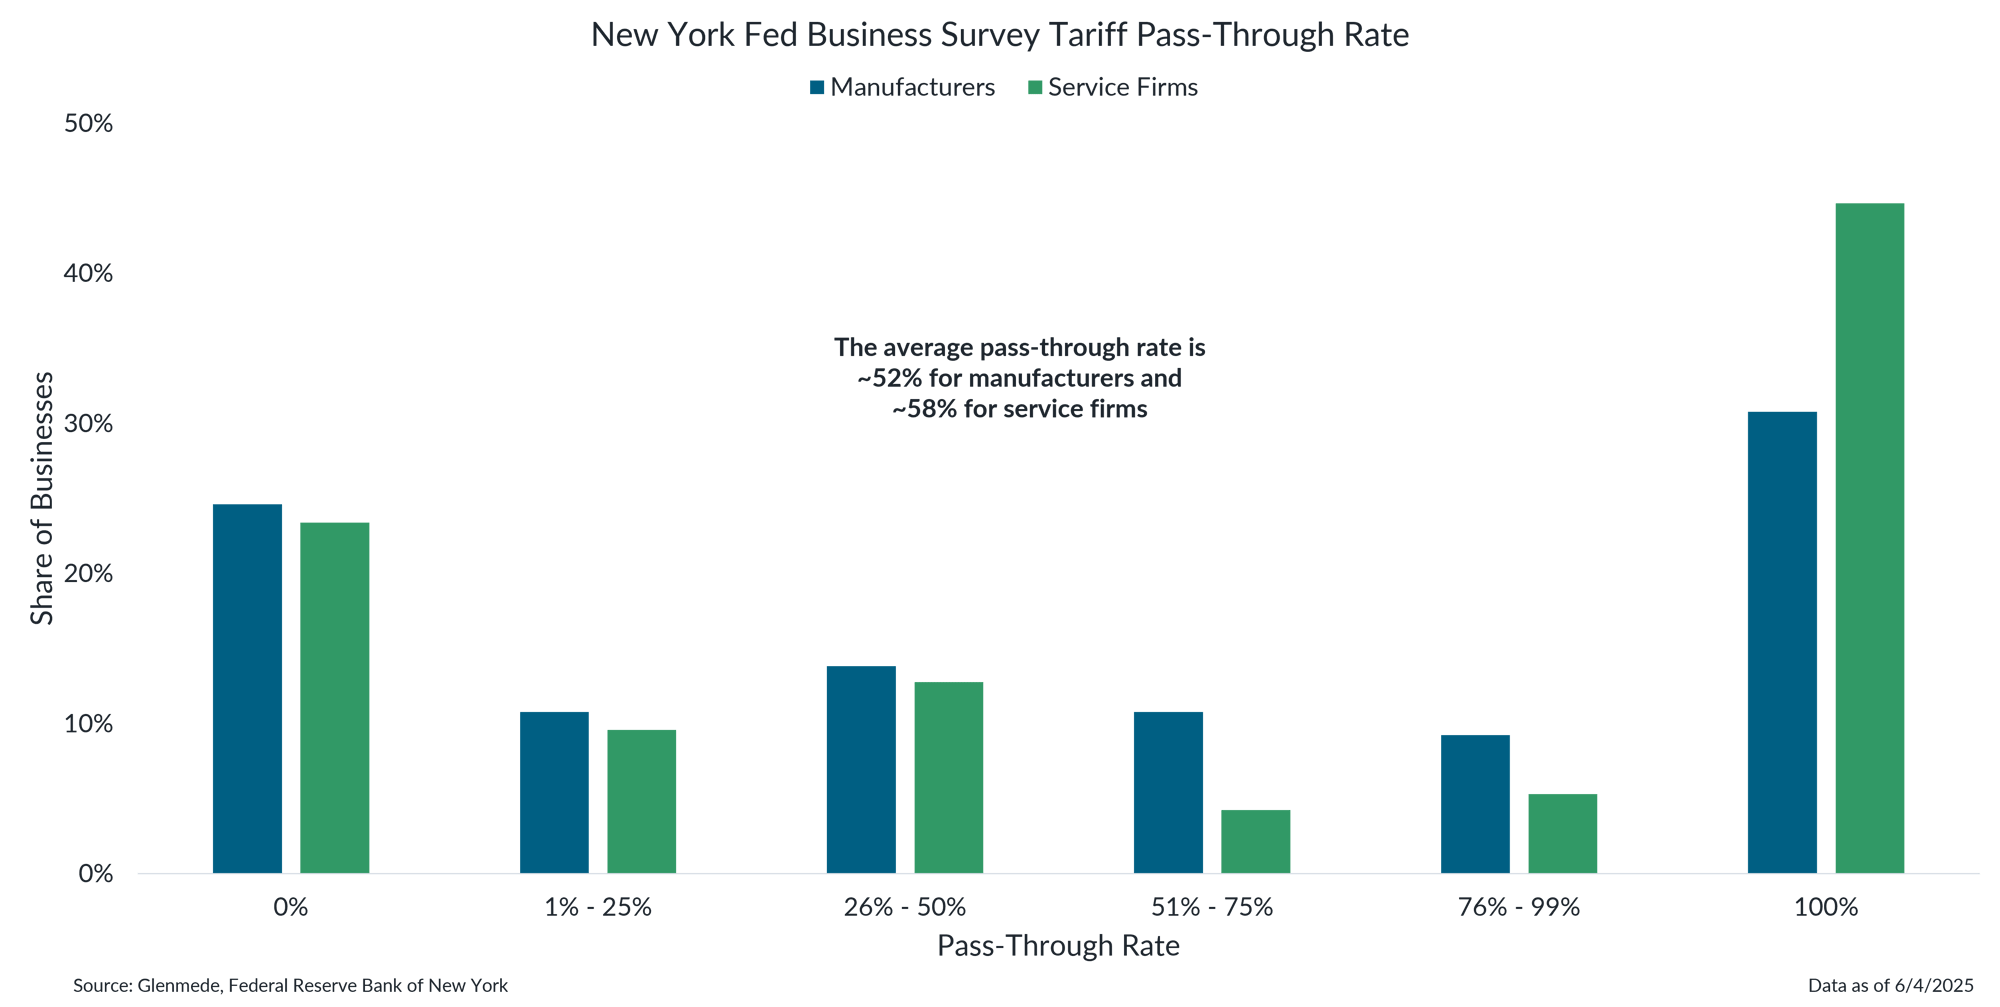
- Business surveys show firms are evenly split between passing tariffs on to consumers and absorbing the costs.
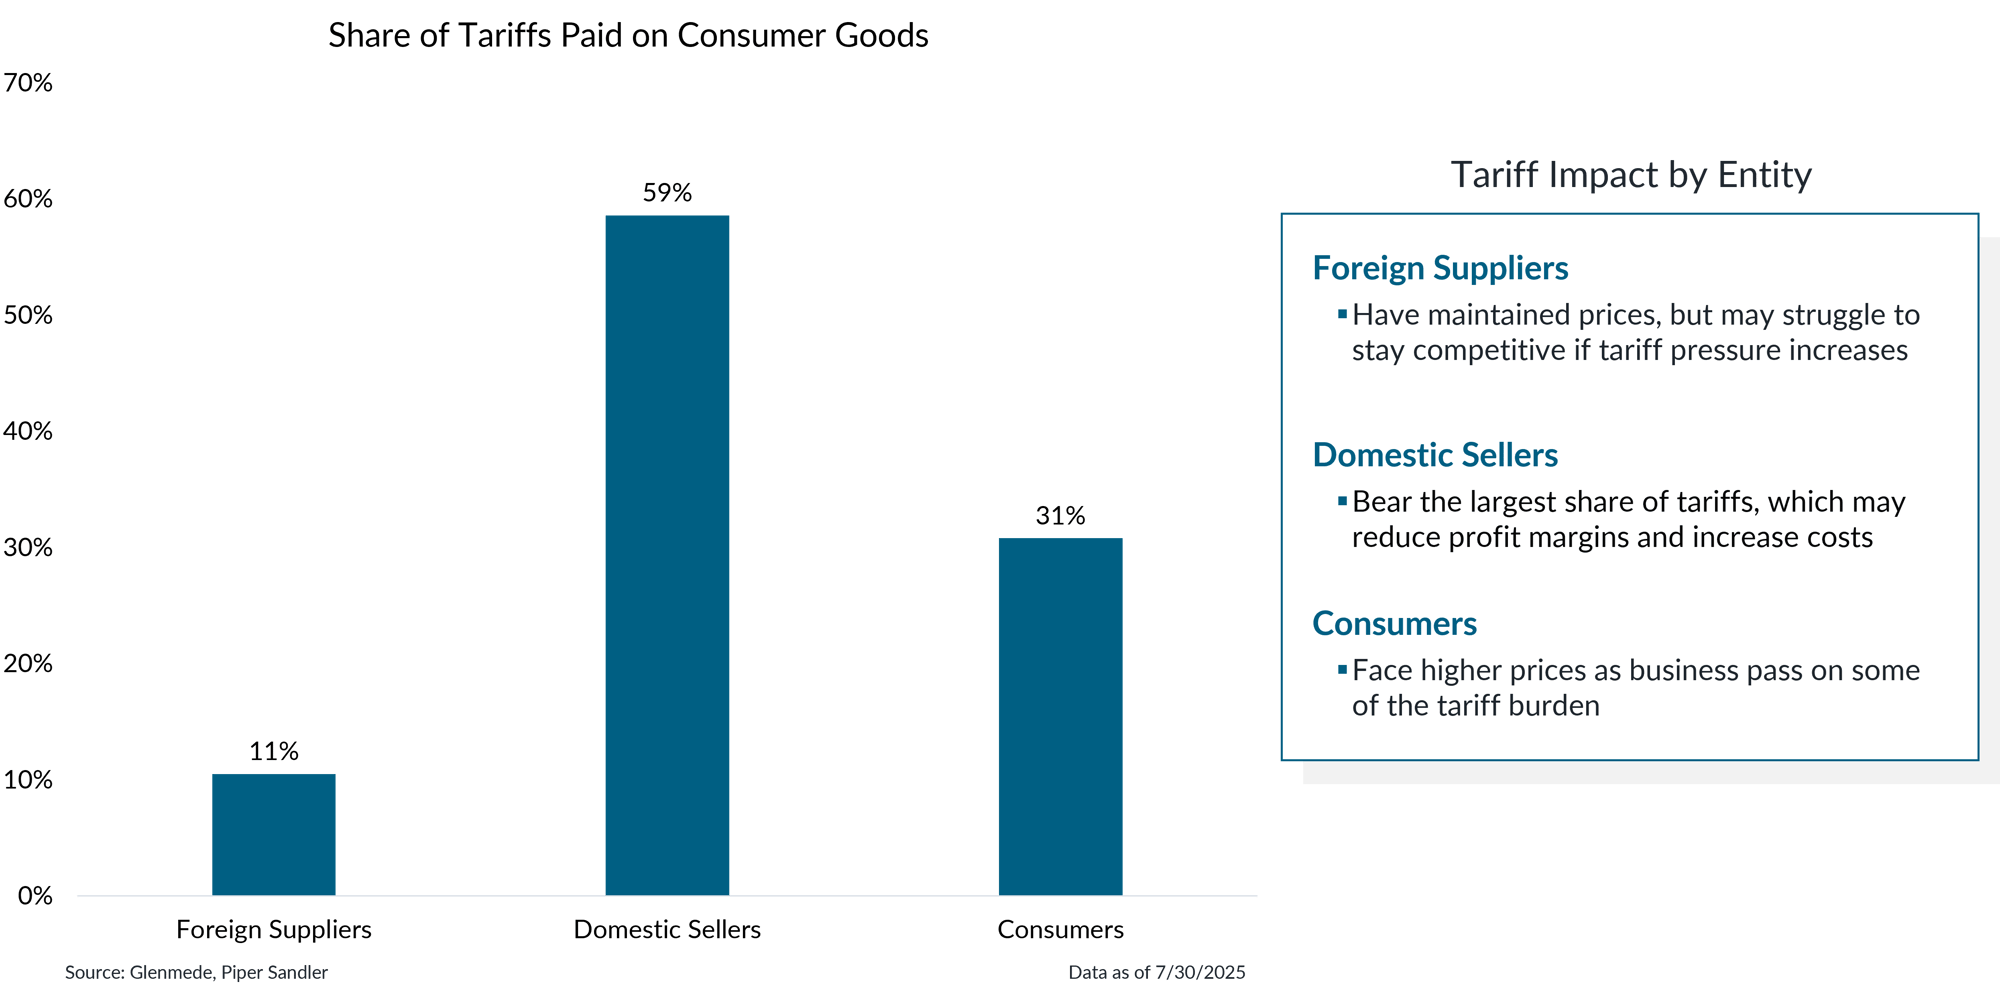
- Pricing data suggests that consumers are currently bearing a third of the costs.
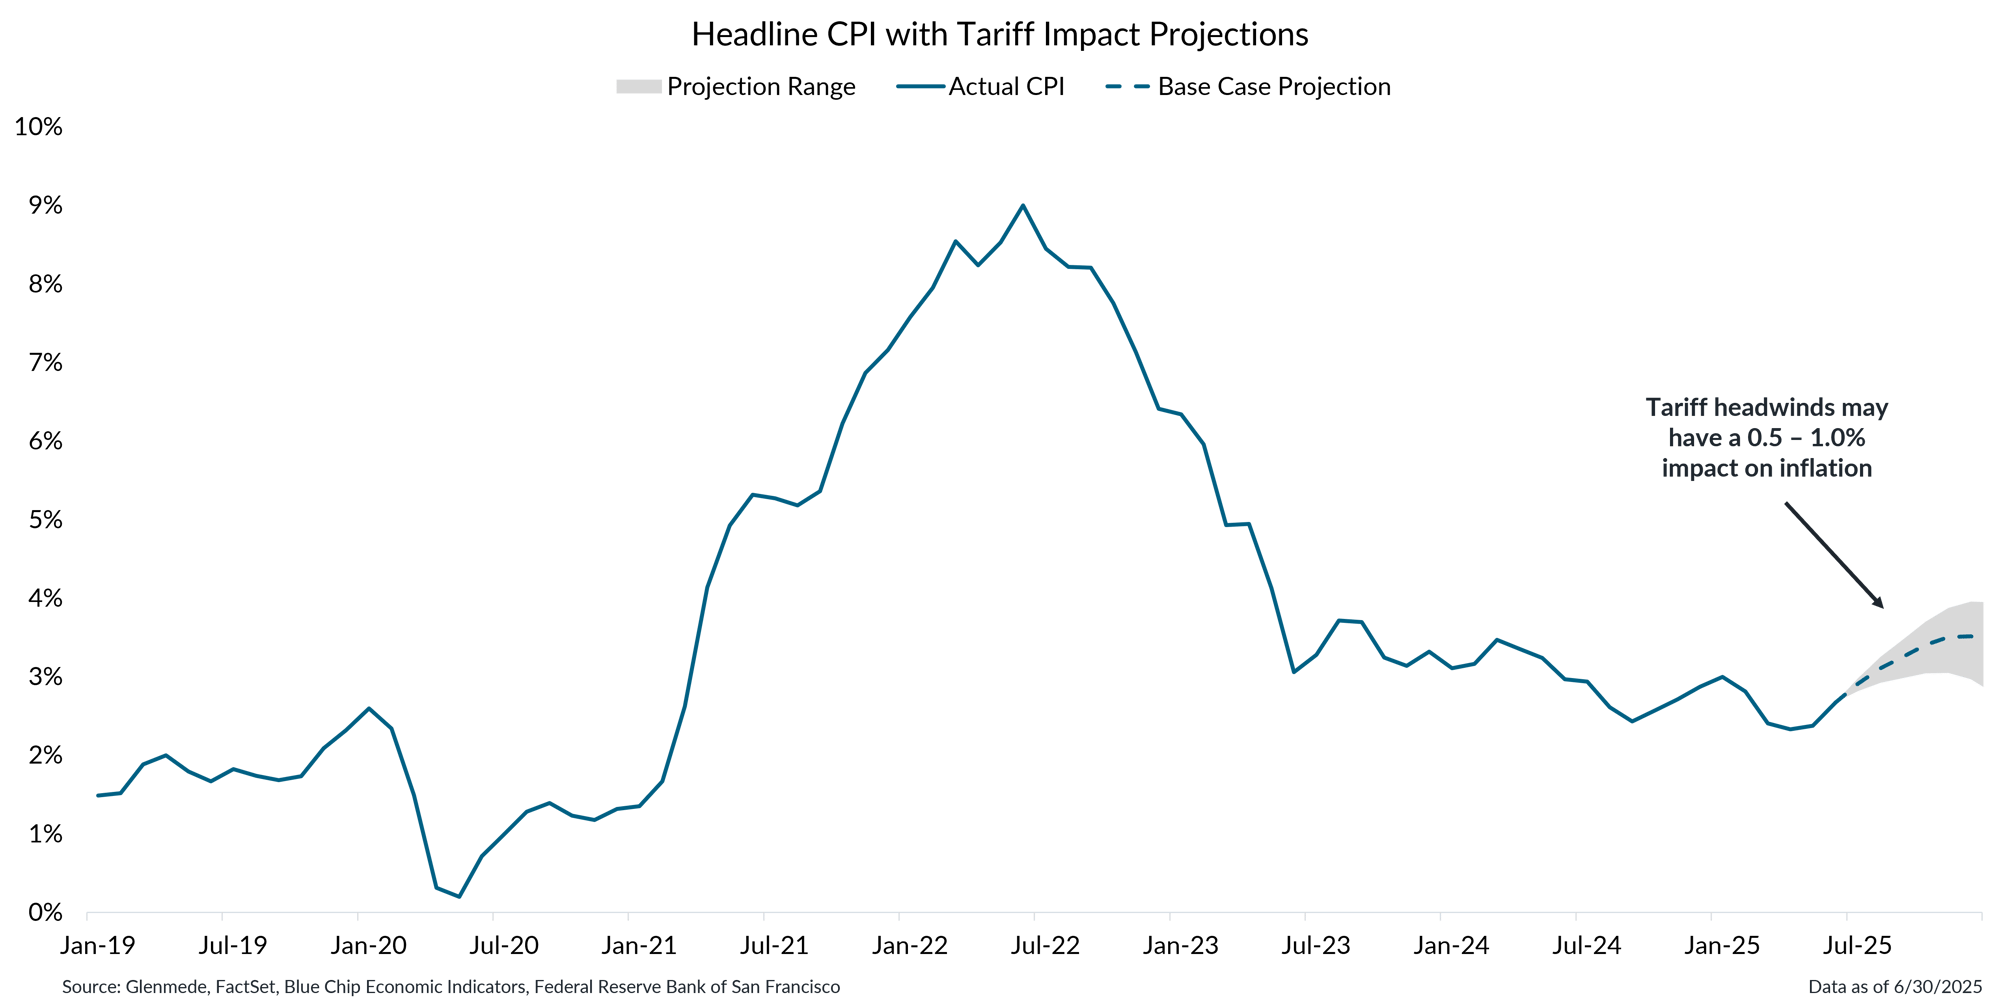
- Although subdued so far, inflation is likely to feel modest upward pressure from tariffs.
- Consumers will likely pay a third to half the cost of tariffs through an additional 0.5 – 1.0% of price inflation.
As tariff policies are implemented, collected duties have grown to nearly 1% of GDP

Shown in the left panel is a timeline of the estimated effective tariff rate based on tariffs announced as of each day since President Trump’s second inauguration. The effective tariff rate is expressed as a percentage, calculated as estimated revenues from tariffs over total imports. Historical and projected tariff figures are derived from internal and third-party sources believed to be reliable. Shown in the right panel are the monthly customs duties collected on imports by the U.S. Department of the Treasury. GDP refers to the U.S. Gross Domestic Product.
- Effective tariff rates have fluctuated since the beginning of the year, with Glenmede’s base case expecting them to stabilize between 10% and 15%.
- In June alone, customs duties collected by the Treasury generated $26.6 billion in additional government revenue, equating to 1.1% of GDP.
Business surveys show firms are evenly split between passing tariffs on to consumers and absorbing the costs

Data shown represent the distribution of manufacturers and service firms according to their reported tariff pass-through rates, indicating the percentage of tariff-related cost increases passed on to consumers. The figures are based on a May survey by the Federal Reserve Bank of New York of regional businesses that experienced higher import costs due to tariffs .
- Business surveys suggest that both manufacturers and service firms have passed a portion of tariff-related price increases on to consumers.
- However, with pass-through rates averaging between 50% and 60%, businesses are still absorbing a significant share of the cost themselves.
Pricing data suggests that consumers are currently bearing a third of the costs

Data shown represent the estimated share of consumer goods tariffs paid by foreign suppliers, domestic sellers, and consumers. The consumer share is based on the change in the Consumer Price Index (CPI) for core goods, applied to total annual consumer goods spending. The foreign supplier share is calculated by comparing changes in import prices to the value of consumer goods imports. Both are expressed as a percentage of estimated total annual tariff revenue on consumer goods. The remaining share is attributed to domestic sellers. Totals may exceed 100% due to rounding.
- Rising import prices suggest U.S. businesses are absorbing a significant portion of the costs, potentially squeezing profit margins, while exporters have largely maintained prices, bearing only about 11% of the tariff burden.
- At the same time, increases in everyday goods prices, as measured by the Consumer Price Index, indicate that consumers are shouldering roughly a third of the tariff costs.
Although subdued so far, inflation is likely to feel modest upward pressure from tariffs

Data shown in blue is year-over-year percent change in the U.S. Consumer Price Index (CPI). The dashed blue line represents Glenmede’s base case projections and the gray region represents a range of plausible outcomes. Projections assume all price increases are passed on to consumers. Actual results may differ materially from expectations or projections.
- In recent months, overall inflation has remained relatively low, but the combined impact of tariffs is expected to contribute between 0.5% to 1.0% to inflation.
- While both businesses and consumers appear to be absorbing the tariff burden, potential upward pressure on inflation warrants ongoing monitoring.
This material is provided solely for informational and/or educational purposes and is not intended as personalized investment advice. When provided to a client, advice is based on the client’s unique circumstances and may differ substantially from any general recommendations, suggestions or other considerations included in this material. Any opinions, recommendations, expectations or projections herein are based on information available at the time of publication and may change thereafter. Information obtained from third-party sources is assumed to be reliable but may not be independently verified, and the accuracy thereof is not guaranteed. Any company, fund or security referenced herein is provided solely for illustrative purposes and should not be construed as a recommendation to buy, hold or sell it. Outcomes (including performance) may differ materially from any expectations and projections noted herein due to various risks and uncertainties. Any reference to risk management or risk control does not imply that risk can be eliminated. All investments have risk. Clients are encouraged to discuss any matter discussed herein with their Glenmede representative.

